Doh and Irvine et al. 10.1073/pnas.0509404103. |
Supporting Figure 7
Supporting Figure 8
Supporting Figure 9
Supporting Movie 1
Supporting Movie 2
Supporting Figure 10
Supporting Figure 11
Supporting Movie 3
Supporting Figure 12
Supporting Figure 13
Supporting Movie 4
Supporting Movie 5
Supporting Figure 14
Supporting Text
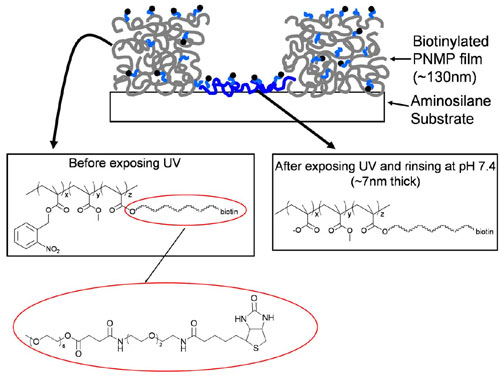
Fig. 7. Chemical structure of PNMP before and after UV exposure, and schematic structure of patterned surface shown in Fig. 2Aii. The patterned film schematic illustrates the presence of biotinylated PNMP side chains throughout the PNMP thin film. When UV-exposed regions are developed with near-neutral PBS, the bulk of the film dissolves, except for a thin molecular layer of the resist copolymer, which remains electrostatically bound to the underlying aminosilane substrate.

Fig. 8. Measurement of patterned ICAM-1 surface stability. (A) Schematic of labeling and detection procedure for assaying the stability of immobilized ICAM-1. (B) Fraction of surface-bound ICAM-1 remaining as a function of time, as determined by the fluorescence ratio [IFITC/IAlexa-647]t/[IFITC/IAlexa-647]t = 0 for ICAM-1-loaded patterned surfaces incubated at 37° C in PBS, pH 7.4. Data shown are average ± SD of five to six independent samples at each time point.
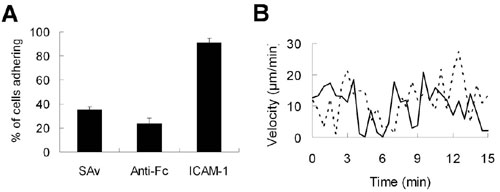
Fig. 9. Adhesion and migration of primed CD4+ T cell on ICAM-1-modified PNMP photoresist films. (A) Adhesion of OT-II T cells on ICAM-1-presenting surfaces, or surfaces bearing the linkage intermediates (SAv alone or anti-Fc antibody linked to SAv). (B) Instantaneous velocities vs. time of two representative OT-II T cells on tethered ICAM-1 surfaces.
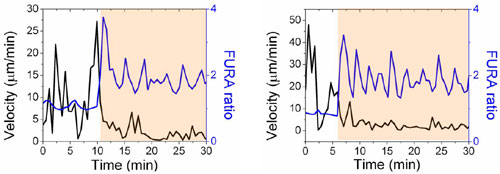
Fig. 10. Representative instantaneous velocities and average fura ratios of two different single T cells encountering activation sites on immunological synapse surfaces. Left-hand edges of the orange-shaded regions denote the time-point of initial contact with the activation site. Traces show the near-simultaneous drop in T cell velocity and elevation of intracellular calcium levels coincident with contact of activation sites.

Fig. 11. T cell localization to activation sites 30 min after seeding on immunological synapse surfaces presenting arrayed spots of anti-CD3 vs. control surfaces bearing arrayed spots of a control IgG. Representative overlay micrographs of brightfield and activation site fluorescence images for patterned anti-CD3 surfaces (A) and control surfaces (B) are shown, with T cells localized to activation sites highlighted by a red false color overlay. (C) Percentages of cells contacting activation sites and percentages of sites occupied for anti-CD3 or control IgG activation sites are shown (average ± SD).

Fig. 12. Normalized IL-2 secretion by T cells cultured on "focal" synapse arrays as a function of activation site diameter (A) or anti-CD3 density within activation sites (B). (A) Three-micrometer-diameter activation sites, with one quarter the surface area of 6-m m-diameter sites (and therefore, one quarter as much total anti-CD3 displayed to each T cell), triggered IL-2 production in T cells at correspondingly lower levels relative to 6-m m-diameter anti-CD3 sites. (B) Ligand density was varied by mixing biotinylated anti- CD3 with biotinylated irrelevant antibody (Rat IgG) at different ratios (indicated by the percentages) during coupling to the activation sites; IL-2 production by T cells exhibited a dose-dependent response to the density of anti-CD3 presented.
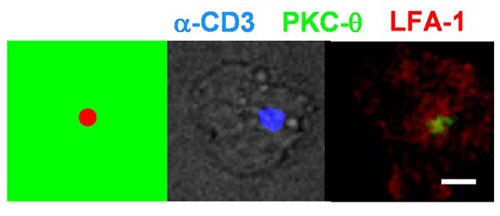
Fig. 13. Representative micrographs of the immunological synapse formed by a T cell interacting with a 2-m m activation site. (Scale bar: 5 m m.)

Fig. 14. Subcellular localization of TCR and cytoplasmic phosphotyrosine (pY) in T cells interacting with "focal" and "annular" anti-CD3 activation sites. T cells were fixed, permeabilized, and stained 10 min after seeding on synapse surfaces. (A and B) Representative micrographs of 5C.C7 CD4+ T cells interacting with focal and annular activation sites, respectively: DIC/activation site fluorescence overlay (Upper Left), TCR (Upper Right), pY (Lower Left), and TCR/pY overlay (Lower Right). (Scale bars: 5 m m.) (C) TCR-phosphotyrosine colocalization. TCR/pY immunostaining images were analyzed as described (1). Average values are shown as solid bars (focal activation sites, n = 18; annular activation sites, n = 27). Differences in the TCR/pY colocalization on focal and annular activation sites were not statistically significant (P = 0.99).
1. Mossman, K. D., Campi, G., Groves, J. T. & Dustin, M. L. (2005) Science 310, 1191- 1193.
Movie 1. A T cell interacting with an isotype control antibody spot. DIC/isotype control antibody spot (blue) overlay (Left) and false color FURA ratio (Right).
Movie 2. A T cell interacting with an activation site. DIC/activation site fluorescence (blue) overlay (Left) and false color FURA ratio (Right).
Movie 3. A T cell undergoing cell division on the immunological synapse array.
Movie 4. A T cell interacting with anti-CD3 (blue) focal pattern.
Movie 5. Two T cells interacting with anti-CD3 (blue) annular pattern.