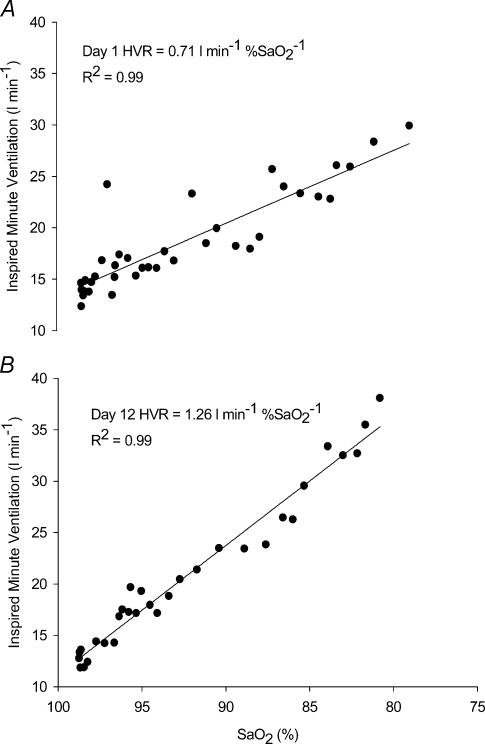
Figure 2. The relationship between ventilation and arterial oxyhemoglobin saturation.
The relationship between ventilation and arterial oxyhemoglobin saturation (i.e. the HVR) for one individual subject on (A) day 1 and (B) on day 12.  , inspired minute ventilation; SaO2, arterial oxyhaemoglobin saturation.

