Ruan et al. 10.1073/pnas.0601940103. |
Supporting Figure 5
Supporting Figure 6
Supporting Materials and Methods
Supporting Figure 7
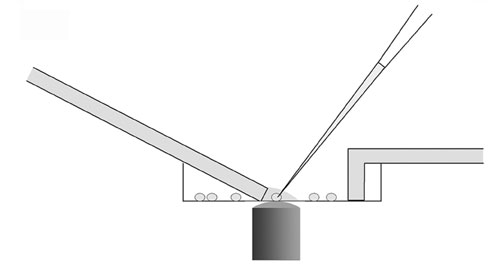
Fig. 5. The cell harvesting method is shown. A perfusion system was used to avoid medium contamination of the PCR samples. The outlet speed was faster than the inlet flow so that the depth of medium over the target cell was minimized during harvesting.

Fig. 6. Expression rates of six core clock genes in six types of retinal cells. (a) Per1 was expressed in >67% of each retinal neuron type (horizontal, bipolar, amacrine, and ganglion) but only in 26% of rods (P < 0.01, c2 test). Similarly, as shown in b-e, Per2, Cry1, Cry2, and Clock also showed high rates of expression in other retinal neurons (>44%) and significantly lower rates of expression (<28%) in rods (P < 0.01). (f) In contrast to all other clock genes, there was no significant difference between rods and other retinal neurons in the percentage of cells positive for Bmal1 expression, which ranged from 32–52% across all of the cell types tested. *, P < 0.05; **, P < 0.01; ***, P < 0.001.

Fig. 7. Detection of core clock genes in rods and DA cells during the day (ZT 7-8) and night (ZT 19-20). No significant difference was found in the rates of clock gene expression between ZT 7-8 (![]() ) and ZT 19-20 (
) and ZT 19-20 (![]() ) in either rods (a) or DA cells (b).
) in either rods (a) or DA cells (b).
Supporting Materials and Methods
For collection of individual retinal neuron contents for RT-PCR, culture dishes were kept at room temperature, and cells were observed with an inverted microscope (Nikon). A modified perfusion system was used to avoid medium contamination of the RT-PCR samples (Fig. 5). The inlet tube perfused the target cell with Ames’ medium (Sigma; supplemented with 10 mM Hepes and 10 mM glucose, pH 7.4). The outlet speed was a little faster than the inlet speed. When there was very little medium left near the target cell, the tip of the glass pipette, filled with 10 ml of diethylpyrocarbonate (DEPC)-treated intracellular solution (containing 140 mM KCl, 5 mM EGTA, 3 mM MgCl2, and 5 mM Hepes, pH 7.4), was quickly moved to the target cell. During this process, positive pressure was continuously applied to the pipette. A seal was formed on the target cell, and cellular contents were aspirated into the pipette by gently applying negative pressure. The tip of the pipette was then quickly lifted from the culture dish, positioned in front of a perfusion tube, washed with fresh medium for 1 min, and finally broken into an Eppendorf tube containing 13.5 ml of reverse transcription mixture 1 (containing 10 units of RNase inhibitor, 0.5 ml of 100 mM DTT, 1 ml of 10 mM dNTPs, 1 ml of 3 mg/ml random hexamers, 2.5 ml of 20 mg/ml BSA). The tube was kept on dry ice until the end of the harvesting procedure, which lasted from 30 min to 90 min from the time of plating.
To avoid contamination of the cell samples by RNAs in the extracellular medium, we minimized the depth of the medium over the collected cell and maintained positive pressure on the pipette tip until contact with the collected cell was made (Fig. 5). After harvesting each cell, we also collected medium near the target cell and processed it in parallel to the harvested cell. These medium controls were negative for all six core clock genes in all cells tested. PCR primers were designed to span introns. The amplicon lengths varied from 70 to 94 bp, and PCR products for each reaction were further confirmed to be from cDNA, not genomic DNA, by agarose gel electrophoresis. All probes except the Cry1 probe crossed exon junctions. The two primers of Cry1 were on two exons separated by a 27,119-bp intron. The primer and probe concentrations were optimized following the manufacturer’s directions (Applied Biosystems). The amplification efficiency (E) was determined on a total retinal cDNA dilution series. The E values of clock genes varied from 1.92 to 1.99.
Although the collection and PCR procedures outlined above provided reassurance against false positive clock gene detection, we also assessed the potential rate of false negatives in our data. Per1, Per2, Cry2, and Clock were all detected at relatively high rates (>60%) in retinal neuron populations, and, in some cases, near 100% expression rates were obtained (Fig. 6 a, b, d, and e). Although we cannot rigorously exclude the possibility of false negatives in the rates of those genes, the potential for such errors is demonstrably low. The overall rates of expression for Cry1 and Bmal1 were significantly lower than for the other clock genes (P < 0.05) (Fig. 6 c and f); thus, we further evaluated the potential rates of false negatives for Cry1 and Bmal1 expression. We subjected entire cDNA pools from individual rod bipolar cells to analysis for either Cry1 or Bmal1, instead of fractionating the pools for all seven genes as usual, to exclude the possibility of low detection rates due to low transcript numbers of these genes. Using this procedure, Cry1 expression was detected in 13 out of 22 bipolar cells (59% vs. previous 42%), while Bmal1 expression was detected in 10 out of 17 bipolar cells (59% vs. previous 52%). Thus the rate of expression for Cry1 is likely to be underestimated in the above data by 15–20%, whereas the rate of expression for Bmal1 may be underestimated by only 5–10%. The verified low expression rates of these two genes across retinal neuron types effectively caps the rate at which retinal neurons could express all of the core clock genes at a maximum of about 50%.
We intended to use the housekeeping gene GAPDH as a reference gene for normalization, because it has been used in previous studies of other circadian tissues. However, we found that GAPDH expression itself exhibited diurnal and circadian oscillations in the mouse retina (data not shown), which is consistent with findings in chicken and rat retinas (1, 2). Therefore, in the present study, we confirmed that the primer and probe sets for all six core clock genes have similar RT-PCR efficiencies using RNA samples with known differences in RNA amount (data not shown), and then a standard amount of total retinal RNA (1.0 mg) was used to perform each quantitative real-time RT-PCR (qPCR).
The following primers and probes were designed by using Applied Biosystems PRIMEREXPRESS software and ordered from Applied Biosystems:
Per1
forward 5'-GAAAGAAACCTCTGGCTGTTCCTA-3',Per1
reverse 5'-TGGTTGTACTGGGAATGTTGCA-3',Per1
probe 5'-6FAM-CATCCTCAGGTATTTGGA-MGBNFQ-3';Per2
forward 5'-TGCTGGCAGAGAGGGTACACT-3',Per2
reverse 5'-GGTTGTTGTGAAGATCCTCTTCTCA-3',Per2
probe 5'-VIC-CTATGAAGCGCCTAGAAT-MGBNFQ-3';Cry1
forward 5'-CACCATCCGCTGCGTCTATA-3',Cry1
reverse 5'-CTCAAGACACTGAAGCAAAAATCG-3',Cry1
probe 5'-6FAM-CCTCGACCCCTGGTT-MGBNFQ-3';Cry2
forward 5'-CGTGGAGGTGGTGACTGAGA-3',Cry2
reverse 5'-CTGCCCATTCAGTTCGATGA-3',Cry2
probe 5'-VIC-CACCCTCTATGACCTAGACAG-MGBNFQ-3';Clock
forward 5'-ACGGCGAGAACTTGGCATT-3',Clock
reverse 5'-TGATACGATTGTCAGACCCAGAA-3',Clock
probe 5'-6FAM-CCTGAGACAGCTGCTGACAAAAGCCA-MGBNFQ-3';Bmal1
forward 5'-GAAGGTTAGAATATGCAGAACACCAA-3',Bmal1
reverse 5'-TCCCGACGCCTCTTTTCA-3',Bmal1
probe 5'-VIC-TGGGCCTCCCTTGCAT-MGBNFQ-3';GABA-d
forward 5'-TTATCCGCCTACAGCCTGATG-3',GABA-d
reverse 5'-TTGGCGAGGTCCATGTCA-3',GABA-d
probe 5'-VIC-CATCCGCATCACCTC-MGBNFQ-3'.1. Bailey, M. J., Beremand, P. D., Hammer, R., Reidel, E., Thomas, T. L. & Cassone, V. M. (2004) J. Biol. Chem. 279, 52247-52254.
2. Kamphuis, W., Cailotto, C., Dijk, F., Bergen, A. & Buijs, R. M. (2005) Biochem. Biophys. Res. Commun. 330, 18-26.