
Muñoz-Pinedo et al. 10.1073/pnas.0603007103. |
Supporting Figure 5
Supporting Figure 6
Supporting Movie 1
Supporting Movie 2
Supporting Figure 7
Supporting Movie 3
Supporting Methods
Fig. 5. Tetracysteine-tagged proteins display mitochondrial localization. HeLa-cyt.c-GFP cells were stably (Smac, Omi, and AK2) or transiently (AIF) transfected with the vector encoding the corresponding tetracysteine-tagged protein and stained with the red dye ReAsH. (Scale bars: 20 mm.) Arrow indicates a cell transfected with AIF-TC; other cells in the field did not express the protein.
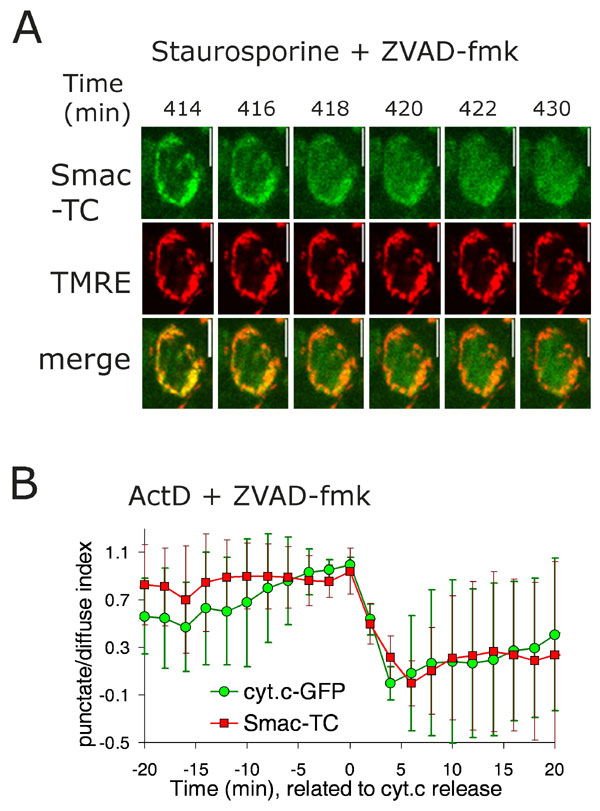
Fig. 6. Smac is released at the time of mitochondrial depolarization. (A) HeLa cells stably expressing Smac-TC were stained with the green dye FlAsH and the mitochondrial dye TMRE and treated with 1 mM staurosporine and 100 mM Z-Val-Ala-Asp(OMe)-CH2F (zVAD-fmk). Images were captured every 2 min. Green and red images from a representative cell indicate Smac translocation and TMRE staining, respectively. Numbers indicate time after addition of staurosporine. The complete sequence of the green (Smac-TC) channel is shown in Movie 1. (B) HeLa-cyt.c-GFP cells stably expressing Smac-TC were stained with the red dye ReAsH and treated with 2 mM actinomycin D and 100 mM zVAD-fmk. Graph shows the scaled average and SD of the punctate/diffuse index for Smac-TC and cytochrome c aligned to the time of cytochrome c release (n = 8 cells). Images were taken every 2 min with a ×60 objective.
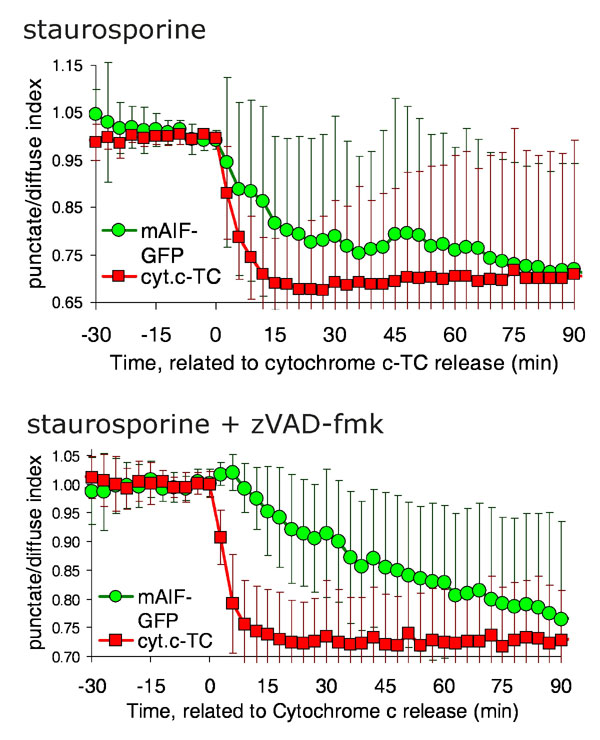
Fig. 7. AIF-GFP is released slowly after staurosporine treatment. HeLa cells stably expressing cytochrome c-TC (1) were transiently transfected with a construct encoding murine AIF-GFP. Cells were stained with the red dye ReAsH to label cytochrome c-tetracysteine. Images were taken every 3 min. Treatments shown are 1 mM staurosporine and staurosporine in the presence of 100 mM zVAD-fmk. Note the large error bars in the averaged signal for AIF after the point of cytochrome c release due to the heterogeneity in the response, because some cells released very little or no detectable AIF-GFP.
1. Goldstein, J. C., Munoz-Pinedo, C., Ricci, J. E., Adams, S. R., Kelekar, A., Schuler, M., Tsien, R. Y. & Green, D. R. (2005) Cell Death Differ. 12, 453-462.
Movie 1. Smac is released in 5 min. HeLa cells stably expressing Smac-TC were stained with the dye FlAsH that binds to the tetracysteine tag of Smac. Cells were treated with 1 mM staurosporine and 100 mM zVAD-fmk, incubated for 3 h, and transferred to the microscope stage. (Frame rate: 10 frames/sec). Images were taken every 2 min (total duration of the adquisition was 3 h 40 min). Frames of this movie are shown in Fig. 6.
Movie 2. Omi and cytochrome c are released simultaneously. HeLa cells stably expressing cytochrome c-GFP were transiently transfected with a construct encoding Omi-TC. Forty hours after transfection, cells were stained with the red dye ReAsH that binds to the TC tag of Omi (shown in Middle). Cells were treated with 1 mM staurosporine and 100 mM zVAD-fmk, incubated for 3 h 30 min and transferred to the microscope stage. Middle shows localization of AIF-GFP. Images were taken every 3 min. (Frame rate: 10 frames/sec.) Total duration of the picture acquisition was 3 h and 15 min). Frames of this movie are shown in Fig. 2C.
Movie 3. AIF is released more slowly than cytochrome c. HeLa cells stably expressing cytochrome c-TC were transiently transfected with a vector encoding human AIF-GFP. Forty hours after transfection, cells were stained with the red dye ReAsH that binds to the tetracysteine tag of cytochrome c (shown in Left). Cells were treated with 1 mM staurosporine, incubated for 3 h 30 min, and transferred to the microscope stage. Middle shows localization of AIF-GFP. Propidium iodide (0.5 mg/ml) was added to the medium: Bright red staining is shown in Left, and purple color in Right shows binding of propidium iodide to the nucleus of permeable cells. Images were taken every 3 min. (Frame rate: 10 frames/sec.) Total duration of the acquisition was 11 h 24 min. Analysis of this movie is shown in Fig. 4D.
Supporting Methods
Constructs.
A retroviral pBABE-based vector encoding the amino acid sequence for the C-terminal aPG tetracysteine tag (AAREACCPGCCVKTE) (1) was generated by insertion of the sequence encoding the tag into SalI-opened pBABE-puro, and elimination of the 3' SalI site. This vector was used for the generation of Smac-tetracysteine (TC), adenylate kinase 2 (AK2)-TC and Omi-TC retroviral vectors through insertion in the SalI site. Smac was amplified by using the primers 5'-gtcgacATGGCGGCTCTGAAGAGTTG and 3'-gtcgacATCCTCACGCAGGTAGGC, from a plasmid donated by X. Wang (University of Texas Southwestern Medical Center, Dallas, TX). AK2 was amplified from Human Heart Marathon-Ready cDNA (BD Biosciences) by using the primers 5'-gtcgacATGGCTCCCAGCGTGCCAGC and 3'-gtcgacGATAAACATAACCAAGTCTT. Omi was amplified from a vector obtained from L. Miguel Martins (Medical Research Council, Leicester, U.K.) with the primers 5'-gtcgacATGGCTGCGCCGAGGGCGG and 3'-gtcgacTTCTGTGACCTCAGGGGTCAC. Human AIF-TC was generated by the addition of staggered oligonucleotides encoding the tetracysteine tag FLNCCPGCCMEP (2) to the C-terminus of AIF amplified from a plasmid donated by C. Duckett (University of Michigan, Ann Arbor, MI).Virus Production.
Viruses were made by transfecting 293T cells by a standard calcium phosphate DNA coprecipitation transfection method by using the retroviral vector, a vector encoding Gag-pol, and a vector encoding the VSVG envelope protein. Twelve hours after transfection, cells were incubated in culture media supplemented with 10 mM n-butyric acid (Sigma-Aldrich) for 10 h. Supernatants were collected at 12, 24, and 48 h after the butyrate shock. Polybrene (5 mg/ml; Sigma-Aldrich) was added to the viral supernatants after collection. Supernatants were either frozen or added to the cells during 6 h for each round of infection.Protein Labeling with Biarsenical Ligands.
The staining medium was prepared by the addition of a premixed DMSO stock solution to give a final concentration of 2.5 mM of the green dye fluorescein arsenical helix binder (FlAsH)-EDT2 or the red dye resorufin arsenical helix binder (ReAsH)-EDT2 (22) and 10 mM 1,2-ethanedithiol (EDT; Fluka) in DMEM. Cells were incubated at 37°C in 5% CO2/95% air for 2 h. Cells were then rinsed in glucose-containing Hanks buffered saline solution (HBSS; GIBCO) and incubated for 15 min at room temperature in HBSS containing 100 mM 2,3-dimercapto-1-propanol (BAL). Cells were washed three times with HBSS and returned to the incubator in culture media for at least 30 min before treatments.Confocal Microscopy.
For time-lapse analysis, cells were grown in poly-D-lysine coated 35-mm glass-bottom microwell dishes (MatTek), and treated in 3 ml of DMEM (GIBCO) supplemented with 10% FCS/20 mM Hepes, pH 7.3/2 mM L-glutamine/200 mg/ml penicillin/100 mg/ml streptomycin sulfate/55 mM 2-mercaptoethanol. 2-mercaptoethanol was not added in experiments with biarsenical dyes, because it can reduce the dye–tetracysteine complexes. After treatment with the apoptotic stimuli, cells were returned to an incubator for 3 (staurosporine) or 6 h (actinomycin D). Tetramethylrhodamine ethyl ester (TMRE) and Mitotracker Red (both from Molecular Probes) were added at a concentration of 40 and 100 nM, respectively. Propidium iodide was added at 0.5 mg/ml. After the appropriate incubation time, media was overlaid with 2 ml of mineral oil (Sav-On, Buena Park, CA), and the dish then was placed in a Leiden MicroIncubator coupled to a Bipolar Temperature Controller (Harvard Apparatus) set at 37°C on the microscope stage. Images were taken every 2 min unless otherwise indicated.Images were acquired by using a Nikon Eclipse TE 300 microscope coupled to a Bio-Rad MRC 1024 confocal head and a 15 mW krypton/argon laser unit. Cytochrome c-GFP, TMRE, and propidium iodide, when used in combination, were excited simultaneously by using a 488-nm line from the laser attenuated at 88–92%, and detected through a 522DF35 bandpass filter (cytochrome c-GFP), a 585EFLP filter (TMRE), or a 680DF32 filter (propidium iodide). Unless indicated, images were taken with a ×60 oil immersion objective. Data from two Kalman-averaged scans were obtained by using Lasersharp 2000 software (Bio-Rad).
1. Adams, S. R., Campbell, R. E., Gross, L. A., Martin, B. R., Walkup, G. K., Yao, Y., Llopis, J. & Tsien, R. Y. (2002) J. Am. Chem. Soc. 124, 6063-6076.
2. Martin, B. R., Giepmans, B. N. G., Adams, S. R. & Tsien, R. Y. (2005) Nat. Biotech. 23, 1308-1314.