Butovsky et al. 10.1073/pnas.0604681103. |
Supporting Figure 6
Supporting Figure 7
Supporting Materials and Methods
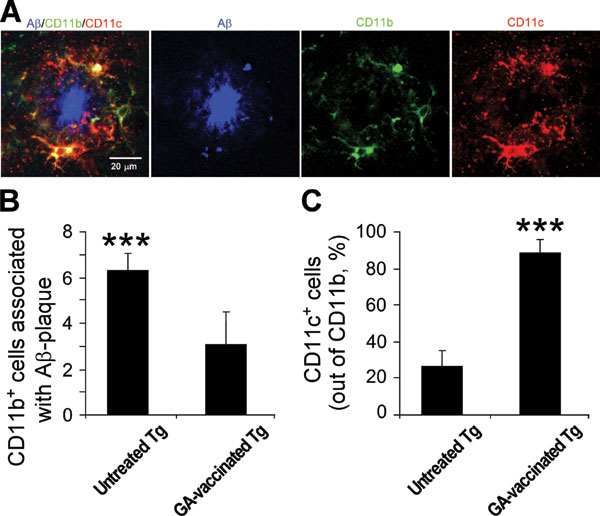
Fig. 6. GA vaccination induces microglia to express CD11c. (A) CD11b+ microglia coexpressing CD11c surround an Ab-plaque in GA-vaccinated Tg-AD mice. All of the CD11c-expressing microglia are colabeled for CD11b. A separate confocal channel is shown. (B) Histograms showing the number of CD11b+ cells associated with Ab -plaque. (C) Histograms showing quantification of CD11c+ cells as a percentage of the total number of CD11b+ and CD11c+ cells associated with an Ab plaque. For this analysis we counted the cells surrounding 30-50 plaques in each mouse tested. Error bars represent means ± SEM. Asterisks above bars denote the significance of differences between the groups (***, P < 0.001; two-tailed Student’s t test).

Fig. 7. Engulfment of aggregated Ab by activated microglia. (A and B) Microglia were treated with IL-4 (10 ng/ml) 24 h after seeding or were left untreated for 48 h. The media were then replaced by a labeling medium (DMEM containing 10 mg/ml BSA) (1), and aggregated Ab(1-40) was added (5 mg/ml) for 1 h. After incubation the cultures were then rinsed, fixed, and immunostained with antibodies directed to human Ab and costained for microglia (IB-4). (A) Confocal photomicrographs. (B) The specificity of internalized Ab immunoreactivity in microglia activated by IL-4 in three dimensions is demonstrated by the orthogonal projection. (C) Quantitative analysis expressed as intensity per cell. Data are the results (means ± SD) of one of two experiments, each containing eight replicates (20-30 cells per replicate) per group.
1. Paresce, D. M., Ghosh, R. N. & Maxfield, F. R. (1996) Neuron 17, 553-565.
Supporting Materials and Methods
Neural Progenitor Cell Culture. Coronal sections (2 mm thick) of tissue containing the subventricular zone of the lateral ventricle were obtained from the brains of adult C57BL/6J mice. The tissue was minced and then incubated for digestion at 37°C and 5% CO2 for 45 min in Earle’s balanced salt solution containing 0.94 mg/ml papain (Worthington, Lakewood, NJ) and 0.18 mg/ml L-cysteine and EDTA. After centrifugation at 110 × g for 15 min at room temperature, the tissue was mechanically dissociated by pipette trituration. Cells obtained from single-cell suspensions were plated (3,500 cells per cm2) in 75-cm2 Falcon tissue-culture flasks (BD Biosciences, San Diego), in neural stem/progenitor cell (NPC) culturing medium (DMEM/F12 medium, Gibco/Invitrogen, Carlsbad, CA) containing 2 mM L-glutamine, 0.6% glucose, 9.6 mg/ml putrescine, 6.3 ng/ml progesterone, 5.2 ng/ml sodium selenite, 0.02 mg/ml insulin, 0.1 mg/ml transferrin, 2 mg/ml heparin (all from Sigma-Aldrich), fibroblast growth factor 2 (human recombinant, 20 ng/ml), and epidermal growth factor (human recombinant, 20 ng/ml) (both from PeproTech, Rocky Hill, NJ). Spheres were passaged every 4-6 days and replated as single cells. GFP-expressing NPCs were obtained as previously described (1).
Primary Microglial Culture
. Brains from neonatal (P0-P1) C57BL/6J mice were stripped of their meninges and minced with scissors under a dissecting microscope (Stemi DV4, Zeiss) in Leibovitz-15 medium (Biological Industries, Kibbutz Beit Ha-Emek, Israel). After trypsinization (0.5% trypsin, 10 min, 37°C/5% CO2) the tissue was triturated. The cell suspension was washed in culture medium for glial cells [DMEM supplemented with 10% FCS (Sigma-Aldrich), L-glutamine (1 mM), sodium pyruvate (1 mM), penicillin (100 units/ml), and streptomycin (100 mg/ml)] and cultured at 37°C/5% CO2 in 75-cm2 Falcon tissue-culture flasks (BD Biosciences) coated with polyD-lysine (PDL) (10 mg/ml; Sigma-Aldrich) in borate buffer [2.37 g of borax and 1.55 g of boric acid dissolved in 500 ml of sterile water (pH 8.4)] for 1 h, then rinsed thoroughly with sterile, glass-distilled water. Half of the medium was changed after 6 h in culture and every second day thereafter, starting on day 2, for a total culture time of 10-14 days. Microglia were shaken off the primary mixed brain glial cell cultures (150 rpm, 37°C, 6 h) with maximum yields between days 10 and 14, seeded (105 cells per milliliter) onto PDL-pretreated 24-well plates (1 ml per well; Corning, New York), and grown in culture medium for microglia [RPMI medium 1640 (Sigma-Aldrich) supplemented with 10% FCS, L-glutamine (1 mM), sodium pyruvate (1 mM), 2-mercaptoethanol (50 mM), penicillin (100 units/ml), and streptomycin (100 mg/ml)]. The cells were allowed to adhere to the surface of a PDL-coated culture flask (30 min, 37°C/5% CO2), and nonadherent cells were rinsed off.Coculturing of Neural Progenitor Cells and Microglia.
Cultures of treated or untreated microglia were washed twice with fresh NPC differentiation medium (same as the culture medium for NPCs but without growth factors except for 0.02 mg/ml insulin and with 2.5% FCS) (2) to remove all traces of the tested reagents, then incubated on ice for 15 min and shaken at 350 rpm for 20 min at room temperature. Microglia were removed from the flasks and immediately cocultured (5 × 10⁴ cells per well) with NPCs (5 × 10⁴ cells per well) for 10 days on coverslips coated with Matrigel (BD Biosciences) in 24-well plates in the presence of NPC differentiation medium. The cultures were then fixed with 2.5% paraformaldehyde in PBS for 30 min at room temperature and stained for neuronal and glial markers.Administration of BrdU
and Tissue Preparation. The cell-proliferation marker BrdU was injected i.p. (50 mg/kg of body weight; 1.25 mg of BrdU in 200 ml of PBS). Starting from experimental day 22 after the first GA vaccination, BrdU was injected i.p. twice daily every 12 h for 2.5 days to label proliferating cells. Three weeks after the first BrdU injection the mice were deeply anesthetized and perfused transcardially, first with PBS and then with 4% paraformaldehyde. The whole brain was removed, postfixed overnight, and then equilibrated in phosphate-buffered 30% sucrose. Free-floating 30-mm sections were collected on a freezing microtome (Leica SM2000R) and stored at 4°C before immunohistochemistry.Immunocytochemistry and Immunohistochemistry
. Coverslips from cocultures of NPCs and mouse microglia were washed with PBS, fixed as described above, treated with a permeabilization/blocking solution containing 10% FCS, 2% BSA, 1% glycine, and 0.1% Triton X-100 (Sigma-Aldrich), and stained with a combination of mouse anti-b-tubulin (anti-bIII-T) isoform C terminus antibodies (1:500; Chemicon International, Temecula, CA), rat anti-CD11b (MAC1; 1:50; BD Pharmingen, Franklin Lakes, NJ), and hamster anti-CD11c (1:100; eBioscience, San Diego). To capture the microglia we used FITC- or Cy3-conjugated Bandeiraea simplicifolia isolectin B4 (IB-4; 1:50; Sigma-Aldrich). To detect expression of human Ab we used anti-Ab (human amino acid residues 1-17) (mouse, clone 6E10; Chemicon International).For BrdU staining, sections were washed with PBS and incubated in 2 N HCl at 37°C for 30 min. Sections were blocked for 1 h with blocking solution (PBS containing 20% normal horse serum and 0.1% Triton X-100 or PBS containing mouse Ig blocking reagent obtained from Vector Laboratories).
For immunohistochemistry, tissue sections were treated with a permeabilization/blocking solution containing 10% FCS, 2% BSA, 1% glycine, and 0.05% Triton X-100 (Sigma-Aldrich). Tissue sections were stained overnight at 4°C with specified combinations of the following primary antibodies: rat anti-BrdU (1:200; Oxford Biotechnology, Kidlington, U.K.), goat anti-doublecortin (anti-DCX) (1:400; Santa Cruz Biotechnology), and mouse antineuronal nuclear protein (anti-NeuN) (1:200; Chemicon International). Secondary antibodies were FITC-conjugated donkey anti-goat, Cy-3-conjugated donkey anti-mouse, and Cy-3- or Cy-5-conjugated donkey anti-rat (1:200; Jackson ImmunoResearch). For labeling of microglia we used either CD11b (MAC1; 1:50; BD Pharmingen) or FITC-conjugated IB-4. To detect expression of cell-surface MHC-II proteins we used anti-MHC-II antibodies (rat, clone IBL-5/22; 1:50). To detect expression of CD11c we used hamster anti-CD11c (1:100; eBioscience, San Diego, CA). To detect expression of human Ab we used anti-Ab (human amino acid residues 1-17) (mouse, clone 6E10; Chemicon International). Expression of IGF-I was detected by goat anti-IGF-I antibodies (1:20; R&D Systems). Expression of TNF-a was detected by goat anti-TNF-a antibodies (1:100; R&D Systems) (3). T cells were detected with anti-CD3 polyclonal antibodies (rabbit, 1:100; DakoCytomation, CA). DAPI (30 nM; Molecular Probes, Invitrogen) was used for nuclear staining. Sections were then washed with PBS and coverslipped in polyvinyl alcohol with diazabicyclo-octane as antifading agent.
Control sections (not treated with primary antibody) were used to distinguish specific staining from staining of nonspecific antibodies or autofluorescent components, showing no TNF-a.
Quantification and Stereological Counting Procedure
. For microscopic analysis we used a Zeiss LSM 510 confocal laser scanning microscope (×40 magnification). For experiments in vitro we scanned fields of 0.053 mm2 (n = 8-16 from at least two different coverslips) for each experimental group. For each marker 500-1,000 cells were sampled. Cells coexpressing GFP and bIII-T were counted.For in vivo experiments the numbers of Ab plaques and CD11b+ microglia in the hippocampus were counted at 300-mm intervals in six to eight 30-mm coronal sections from each mouse. Neurogenesis in the dentate gyrus was evaluated by counting of premature neurons (DCX+), proliferating cells (BrdU+), and newly formed mature neurons (BrdU+/NeuN+) in six coronal sections (370 mm apart) per mouse brain. To obtain an estimate of the total number of labeled cells per dentate gyrus, the total number of cells counted in the selected coronal sections from each brain was multiplied by the volume index (the ratio between the volume of the dentate gyrus and the total combined volume of the selected sections). Specificity of BrdU+/NeuN+ coexpression was assayed by using the confocal microscope (LSM 510) in optical sections at 1-mm intervals. Quantification of CD3+, CD11b+, and CD11c+ cells were analyzed from 30-50 Ab plaques of each mouse tested in this study. Cell counts, numbers of Ab plaques, and plaque areas in the hippocampus were evaluated automatically by using IMAGE-PRO PLUS 4.5 software (Media Cybernetics, Carlsbad, CA).
Statistical Analysis.
MWM behavior scores were analyzed by using three-way ANOVA. Treatment group and trial block were used as sources of variation to evaluate the significance of differences between mean scores during acquisition trial blocks in the MWM. When the P value obtained was significant, a pairwise Fisher’s least-significant-difference multiple-comparison test was run to determine which groups were significantly different.The in vitro results were analyzed by two-tailed unpaired Student’s t test and by the Tukey--Kramer multiple comparisons test (ANOVA) and are expressed as means ± SEM. Results in vivo were analyzed by two-tailed unpaired Student’s t test or one-way ANOVA and are expressed as means ± SEM.
1. Pluchino, S., Quattrini, A., Brambilla, E., Gritti, A., Salani, G., Dina, G., Galli, R., Del Carro, U., Amadio, S., Bergami, A., et al. (2003) Nature 422, 688-694.
2. Butovsky, O., Ziv, Y., Schwartz, A., Landa, G., Talpalar, A. E., Pluchino, S., Martino, G. & Schwartz, M. (2006) Mol. Cell. Neurosci. 31, 149-160.
3. Campana, W. M., Li, X., Shubayev, V. I., Angert, M., Cai, K. & Myers, R. R. (2006) Eur. J. Neurosci. 23, 617-626.