Supporting Figure 7
Nakano et al. 10.1073/pnas.0606140103. |
Supporting Figure 6
Supporting Figure 7
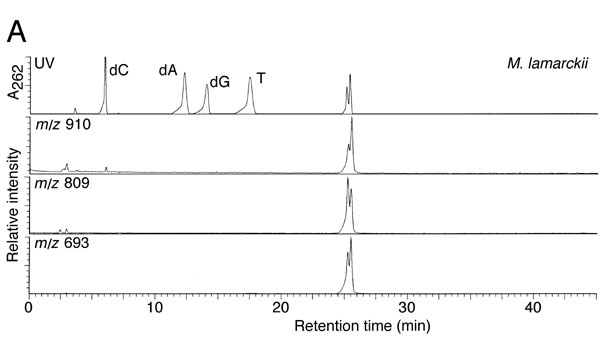
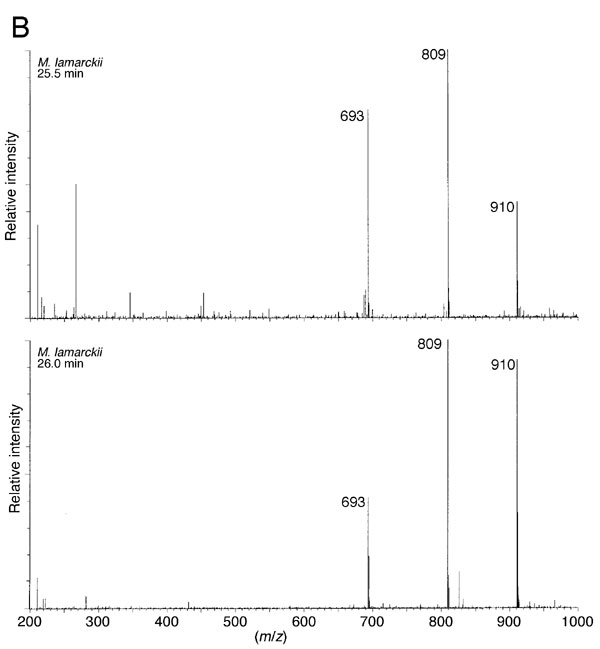
Fig. 6. Liquid chromatography-electrospray ionization-MS analysis of reaction products formed from DNA, partially purified protein, and b-NAD. (A) The HPLC profile (UV) and the ion chromatograms (m/z 910, 809, and 693) of DNA hydrolysate. Similar results were obtained in the analysis of reaction products formed by incubation with pierisin-1. (B) The mass spectrum of the compounds in the peak fractions at retention times of 25.5 min (Upper) and 26 min (Lower) presented in A.

Fig. 7.
HPLC elution patterns of reaction products formed from DNA, in vitro synthesized CARP-1 protein, and 32P-NAD. The 32P-labeled DNA sample was spiked into the nonlabeled DNA sample that contains N2-(ADP-ribos-1-yl)-2'-deoxyguanosine (described in Fig. 2) and injected into a Develosil RPAQUEOUS column. The eluate was monitored by measuring its UV absorbance at 262 nm (Upper). The radioactivity of each fraction collected at 1-min intervals was measured by a Bio-Imaging Analyzer (Lower).