Gray et al. 10.1073/pnas.0602216103. |
Supporting Figure 6
Supporting Figure 7
Supporting Figure 8
Supporting Text
Supporting Figure 9
Supporting Figure 10
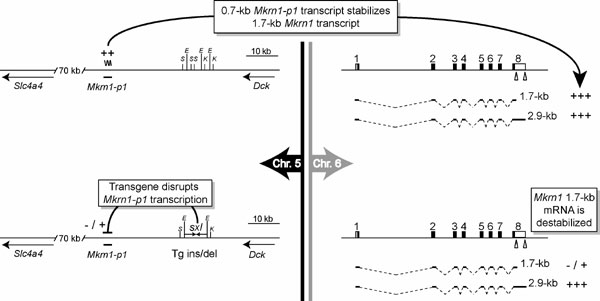
Fig. 6. Summary of the pseudogene trans-regulation model (1). The schematics on the Left represent the chromosome 5 Mkrn1-p1 locus in WT (Upper) and sxl transgenic (Lower) mice, whereas the Right side depicts transcript isoforms from the chromosome 6 Mkrn1 locus. In WT mice, Mkrn1-p1 "robustly" (++) produces a polyadenylated transcript (wavy line) that stabilizes the 1.7-kb Mkrn1 transcript isoform (1). This stabilization supplies enough Makorin-1 protein to allow normal kidney and bone development. Upon sxl transgene insertion/deletion (Lower Left), transcription from Mkrn1-p1 is reduced (-/+), which reduces the trans-stabilization effect on the 1.7-kb Mkrn1 transcript isoform, although the 2.9-kb isoform is unaffected (+++). Destabilization of the 1.7-kb Mkrn1 transcript is assumed to partially reduce the steady-state levels of Makorin-1 protein. Although the overall decrease of Mkrn1 transcripts was not quantitated in sxl transgene mice, a conservative estimate based on the published Northern blots suggests that >60% of full-length Mkrn1 transcripts remain. Mkrn1-p1 flanking genes Slc4a4 and Dck are shown, as are single-letter abbreviations for restriction enzymes SacI (S), EcoRI (E), and KpnI (K) in and near the putative sxl transgene insertion site. The eight-exon Mkrn1 gene is shown on chromosome 6 with two polyadenylation signals in the last exon indicated by triangles. Mkrn1 coding sequence and untranslated regions are indicated by black and white shading, respectively.
1. Hirotsune, S., Yoshida, N., Chen, A., Garrett, L., Sugiyama, F., Takahashi, S., Yagami, K., Wynshaw-Boris, A. & Yoshiki, A. (2003) Nature 423, 91-96.
Fig. 7. Mouse Mkrn1-p1 locus. (A) Alignment of Mkrn1 and Mkrn1-p1 sequences. Mkrn1 cDNA sequence from the initiating methionine (bold green ATG) through the 1.7-kb isoform polyadenylation site is aligned with the homologous Mkrn1-p1 sequence. Changes in Mkrn1-p1 with respect to Mkrn1 are red-shaded, and the sequence given as Mkrn1-p1 cDNA by Hirotsune et al. (1) is yellow-shaded (GenBank accession no. AF494488). Hyphens were added by the MacVector Clustal program to maintain optimal alignment scores. The canonical polyadenylation signal (AATAAA) of Mkrn1 is highlighted in light blue, the position of the 5' end of the Mkrn1-p1 pseudogene is shown in the Mkrn1 sequence by a bold and underlined nucleotide, and the poly(A) tract of the Mkrn1-p1 genomic locus is green shaded. The flanking 16-nt target site duplication that is generated upon retrotransposition is shown in lowercase with pink highlight. Notably, even distribution of the 75 nucleotide differences (counting each insertion/deletion as one event) between Mkrn1 and Mkrn1-p1 in the "transcribed" (yellow) and downstream homology regions throughout this 1,553-nt length would place 34 changes in the 700-nt transcribed region and 41 in the downstream 853-nt region. The observed distribution of changes is 33 and 42 for transcribed and "untranscribed" regions, respectively, nearly identical to the expected values (c2, P = 0.82). This finding clearly shows that the putative transcribed region of Mkrn1-p1 is not evolutionarily constrained from drift away from Mkrn1 and suggests that a previous conclusion (5) is erroneous. Sequences used for the alignment were derived from NM_018810 (Mkrn1) and AC162690 (Mkrn1-p1). (B) Summary of recent, mouse-specific creation of the Mkrn1-p1 pseudogene. A single 16-nt target site (red arrow) is shown in rat (no. 1 with sequence shown in Inset) and a deduced ancestral rodent. This target site was duplicated during retrotransposition of the Mkrn1 cDNA in the mouse lineage (no. 2 and no. 3). The approximate age of the retrotransposition was calculated based on a neutral evolution rate of (6 ´ 10-9 mutations per site per year).
Fig. 8. Sequence of the intron 3/exon 3b Mkrn1 0.75 kb mRNA isoform. (A) Composition of Mkrn1-ex3b mRNA. The first three exons found in the full-length Mkrn1 isoforms are shown in uppercase (underline, exon 1; wavy underline, exon 2; no underline, exon 3), whereas the sequences contributed by exon 3b are shown in bold lowercase. The conserved intron 3 splice donor (gt) and the polyadenylation signal (AATAAA) are in italics. Sequence length is indicated in the right margin. Mouse Mkrn1-ex3b transcripts are exemplified by GenBank accession no. AK078962. Although rat has Mkrn1-ex3b orthologous transcripts (17 ESTs) and the intron 3 polyadenylation signal used by this Mkrn1 isoform, they are absent from other sequenced mammalian genomes including the closely-related guinea pig (data not shown). (B) Conceptual translations for Mkrn1-ex3b and full-length Mkrn1. Amino acids comprising C3H (four motifs), C2H2C, and C3HC4 RING zinc-fingers are in bold with the Cys and His residues reverse shaded. Residue and motif totals for the truncated ex-3b isoform (the C-terminal 15 aa are encoded by exon 3b) and WT proteins are listed. The apparent restriction of Mkrn1-ex3b to recently evolved rodents suggests that this transcript is not essential for mammalian development in general, consistent with the severely truncated Makorin-1 protein it would encode.
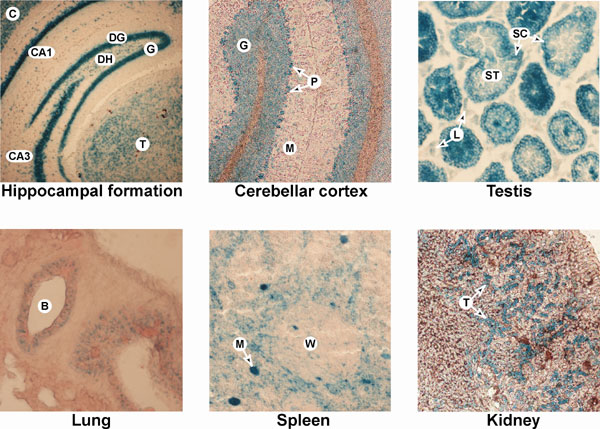
Fig. 9. Histochemical visualization of Makorin1-b-geo fusion proteins in RRB087 heterozygous gene-trapped mice. Tissue sections show distinctive patterns of Makorin1-b-geo fusion protein expression (blue staining). High level expression is seen in the hippocampal formation, cerebellar cortex, and in the testis. Moderate levels of expression were found in lung bronchioles, spleen, and renal tubules. In hippocampal formation, shown are granular (G) and dentate hilar (DH) cells of the dentate gyrus (DG), as well as the CA1 and CA3 fields of Ammon’s horn [note that the cerebral cortex (C) and thalamus (T) are also seen in this section]. In cerebellar cortex, the granular cell layer (G), Purkinje cells (P), and molecular layer (M) are shown. In testis, expression was in the periphery of seminiferous tubules (ST) where Sertoli cells (SC) are found, and some interstitial staining of potential Leydig (L) cells. In lung, a bronchiole (B) is shown. In spleen, the white pulp (W) and a possible megakaryocyte (M) are shown. In kidney, tubules (T) are shown.
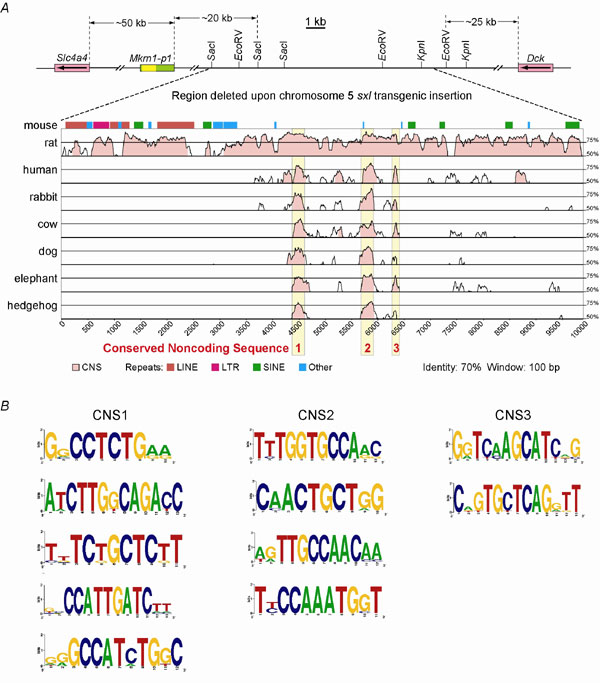
Fig. 10. CNS elements appear to be deleted upon sxl transgenesis. (A) Vista plots of the mouse chromosome 5 region putatively deleted in the sxl transgenic mouse (1). (Upper) The relative positions of the Mkrn1-p1 pseudogene and closest flanking genes to the region that was stated to be deleted on sxl transgene insertion (1) are shown. A key indicates classes of murine repeats in the 10-kb mouse reference sequence, whereas peaks represent the percentage identity for CNSs that mouse shares with rat, human, rabbit, cow, dog, elephant, and hedgehog. Shared CNS regions 1-3 are highlighted in yellow. (B) Logo representations depicting conserved sequences within each CNS. Orthologous regions of each CNS were aligned to identify phylogenetic footprints (data not shown) in the same eight mammalian sequences as for the Vista plot (CNS1-3), with the addition of armadillo sequence for CNS2 and of armadillo and opossum sequences for CNS3. A distillation of these footprints, along with 2 bp of flanking sequence, is shown in a Logo projection. Positions with full-height letters indicate absolutely conserved nucleotides.
1. Hirotsune, S., Yoshida, N., Chen, A., Garrett, L., Sugiyama, F., Takahashi, S., Yagami, K., Wynshaw-Boris, A. & Yoshiki, A. (2003) Nature 423, 91-96.
Supporting Text
Supporting Methods
Bioinformatic Analyses. The genomic DNA sequences used for these analyses were derived from BAC clone sequences in GenBank, including RP24-276E6 (GenBank accession no. AC140001) for the transgene insertion/deletion region, RP24-170F2 (GenBank accession no. AC162690) for Mkrn1-p1, and CH230-266P19 (GenBank accession no. AC109003) for the rat region homologous to the Mkrn1-p1 insertion site. Because we established here that Mkrn1-p1 is not transcribed, we used NCBI BLAST searches of the nonredundant and EST databases (http://www.ncbi.nlm.nih.gov/BLAST/), with the 5' sequence of the Mkrn1 cDNA as a query to identify the origin of the 700-bp transcript (1). We identified an entry (AK078962) that comprised exons 1-3 of the Mkrn1 locus and continued into intron 3, before terminating 22 nt after a potential polyadenylation signal. To determine whether this alternative polyadenylation choice (intron3/exon 3b) is a frequent event, we BLAST-searched the mouse EST database with the exon 3b sequence as a query. Relative abundances of Mkrn1 0.75-kb, 1.7-kb, and 2.9-kb transcript isoforms were estimated by querying the mouse dbEST independently with full-length sequences (see Fig. 1C) and, as an alternative estimate of relative abundance, with the 3' end of each isoform. In the latter analyses, only EST clones that were derived from a priming event at the poly(A) tail were counted in each tally; the numbers of poly(dT)-primed 3' EST clones were 15, 25, and 32 ESTs for the 0.75- (ex3b), 1.7-, and 2.9- kb isoforms, respectively. Mammalian sequences homologous to the mouse region spanning the sxl transgene insertion site (1) were obtained by BLAST searching of NCBI databases and were aligned and analyzed using mVista (www-gsd.lbl.gov/vista/index.shtml) and Logo projections (http://weblogo.berkeley.edu//logo.cgi).
Gene-Trap Mapping, Genotyping, and Phenotyping.
5' RACE information (http://baygenomics.ucsf.edu) suggested a vector insertion downstream of Mkrn1 exon 3. Genomic DNA from RRB087 ES cells was PCR amplified with an exon 3 forward primer (5'-CAGGTTCAGAGGACTGGGTGAAT-3') and a pGT1lxf reverse primer (5'-CAAAGGGAAAGGGTAAAGTGGTAGGG-3'). The PCR product was isolated (QIAquick; Qiagen, Valencia, CA), cloned (pTOPO-II, Invitrogen, Carlsbad, CA), and sequenced (Wadsworth Center Molecular Genetics Core). Mice were genotyped by three-primer PCR: pGT1lxf reverse primer (as above), a Mkrn1 intron 3 forward primer (5'-CTCCTTAGACTTGGTATTCTCTGGG-3'), and a Mkrn1 exon 4 reverse primer (5'-CTCGGTTGATGCCACCTCTGTT-3') generated 605-bp (WT) and 771-bp (gene-trapped) products.Mice were derived by blastocyst injection of the RRB087 BayGenomics ES cell line and transplantation into pseudopregnant dams (Wadsworth Center Transgenics Core). Adult male mice were analyzed histologically. Dissected tissues were fixed in Bouin’s (Sigma, St. Louis, MO) overnight, embedded, sectioned, H&E stained, and examined in a blinded manner by a pathologist (Wadsworth Center Pathology Facility). For assessment of the open-eyes phenotype, mice were visually examined on the morning of their birth. We note that the open-eyelid phenotype used as a diagnostic trait in the previous phenotype-based complementation assay (1) can be a nonspecific developmental delay phenotype resulting from retarded growth of opposing eyelid epithelial fronts (2, 3). b-geo staining of 10-mm cryosectioned gene-trapped mouse tissues was performed as recommended by BayGenomics. All mouse studies were approved by the Wadsworth Center IACUC.
Mkrn1
and Mkrn1-p1 RT-PCR. Newborn brain and kidney total RNAs were prepared with DNase I pretreatment (4PCR; Ambion, Austin, TX) and were reverse-transcribed (SuperScriptII; Invitrogen) using random hexamer and dT(18) oligomer primers. Brain and kidney total RNAs with (+) or without (-) reverse transcriptase, or genomic DNA, were amplified by PCR primers corresponding to the Mkrn1-ex3b mRNA isoform or Mkrn1-p1. We first considered synthesizing the "Mkrn1-p1 specific" primers that had been previously used for RT-PCR-based expression assays (1); however, we unexpectedly found that they did not match Mkrn1-p1 (having 5/20 mismatches on one primer and 1/24 on the other) but instead more closely matched Mkrn1 (1/20 and 0/24 mismatches, respectively; Fig. 2A, primer set 1). We synthesized a new set of primers for Mkrn1-p1 in maximally divergent regions so as to minimize the potential for illegitimate amplification of Mkrn1 (Fig. 2A, primer set 2), as well as a set of primers in Mkrn1 exon 2 and exon 3b (Fig. 2B, primer set 4). Amplification primers for Mkrn1 exon 2 forward (5'-GTCCATACGGCGTAGTGTGCAAG-3') and Mkrn1 exon 3b reverse (5'-GCTGACACTGAGTTCACTGTG-3') or Mkrn1-p1 forward (5'-GCAGCGGTGGCAGCAATGGC-3') and reverse (5'-GATACACAGTTTTCCCCGTAGCAA-3') were used with HotStar polymerase (Qiagen) at 58°C or 63°C, respectively, for 35 cycles.Two additional Mkrn1-p1 amplification primers (Fig. 2A, primer set 3), (5'-AGGCGATAACTGTCAATACTCTCA-3') and (5'-TTTTCCCCGTAGCAACACTCTCC-3') with three total Mkrn1 mismatches, were used to amplify control templates as well as reverse-transcribed kidney RNA by PCR (94°C for 2 min, 95°C for 1 min, 60°C for 20 s, 72°C for 40 s, repeat 34 times, extend at 72°C for 5 min). Fifteen microliters of each of the 50-ml PCR products were digested with 0.7 ml of PstI (New England Biolabs, Ipswich, MA) for 2 h at 37°C.
The Mkrn1 imprinting RT-PCR was performed with Mkrn1 exon 4 forward (5'-CTGCCCCTTCCTGCACTGA-3') and exon 5 reverse (5'-CTCATAGACCACCTCCATGC-3') primers, with a 56°C annealing step and 30 cycles of amplification from brain tissue total RNA of heterozygous Mkrn1 gene-trapped mice that inherited the intact Mkrn1 locus maternally or paternally. Clcn7 primers (5'-CTGTGATCGTGGCCTTCATA-3') and (5'-CTTGATCACCAGCGTCTTGA-3') were used as a positive control. Mkrn1 and Clcn7 products were electrophoresed on the same gel.
Real-Time RT-PCR.
RNA from adult WT and homozygous Mkrn1 gene-trapped littermates was prepared and reverse-transcribed as above. Serial dilutions of the WT cDNAs provided a standard curve of Mkrn1 levels, whereas gene-trapped cDNAs were assayed undiluted. A probe set (Assays-on-Demand; Applied Biosystems, Foster City, CA) of Mkrn1 exon 7 forward (5'-CAGAAAGTGGGAACATCAAGCA-3') and Mkrn1 exon 8 reverse (5'-GCTCCCAGAAGTGGCTCCTT-3') amplification primers and TaqMan probe (5'-CGTTGGGCCCGGTAT-3') was used under standard ABI conditions. Mkrn2 was evaluated using a TaqMan probe set of exon 3 forward (5'-GAAGACGCTGGTGCTCAGAGA-3') and exon 4 reverse (5'-TTGCTTGGAGGAGTCTTATCTTCAG-3') amplification primers and TaqMan probe (5'-CCGCAATCTCACTGGT-3'). Mkrn3 was detected by SybrGreen by using forward (5'-GCAGACAGAGGACCCAAGATGG-3') and reverse (5'-TCAGCAGCCGAGCCAATCAG-3') amplification primers. Data were normalized within tissue types using a set of three widely transcribed genes (Gapdh, Clcn7, and Psmb2). Control templates lacking reverse transcriptase confirmed the absence of genomic DNA contamination in all samples.DNA Methylation Analysis.
We assessed DNA methylation at the 5' end of Mkrn1-p1 and Mkrn1, on both alleles, since the promoters of actively transcribed genes have unmethylated cytosines whereas transcriptionally silenced sequences typically have methylated cytosines. Bisulfite modification of DNA converts this epigenetic information into genetic information by changing the cytosines to uracils, except when the cytosine is methylated. The uracils are read as thymidines by Taq polymerase in subsequent PCR amplification steps, producing a TpG dinucleotide where an unmethylated CpG had been. Genomic DNAs isolated from brain, liver, and kidney from WT mice were bisulfite converted (CpGenome Fast; Chemicon, Temecula, CA) according to the manufacturer’s recommendations. Primers that do not span CpG dinucleotides, and therefore do not discriminate between methylated and unmethylated templates, were used to amplify 5' regions of the Snurf-Snrpn locus (5'-AGAGGGATAGAGATTTTTGTATTG-3' and 5'-CAAATCACTCCTCAAAACCAAA-3'), Mkrn1 (5'-GGATTATTTTAGTATATTTGGTTAAG-3' and 5'-CTATTTATCCCACACAACAATAACC-3'), or Mkrn1-p1 (5'-GATGTGGTTTTGATAATATTAGTAG-3' and 5'-TACAAATAATCTATTTTATTCAACC-3'), using HotStar Plus Taq polymerase (Qiagen). Cycling conditions were as follows: step 1, 95°C for 10 min; step 2, 95°C for 15 seconds; step 3, 50°C (Snurf-Snrpn) or 47°C (Mkrn1) or 46°C (Mkrn1-p1) for 30 s; step 4, 72°C for 1 min; step 5, repeat 36 times; and step 6, extend at 72°C for 10 min. The amplified products were run on an agarose gel, and the products were excised and purified (Qiagen). The purified products were used directly for cloning [into pCR2.1 (Invitrogen) or pGEM-T (Promega, Madison, WI)] and DNA sequence analysis or were reamplified for 20 cycles with a high-fidelity polymerase (Accuprime, Invitrogen) for AciI digestion. Fifteen microliters of reamplified products were digested by the addition of 5 ml of a master mix equivalent to 3 ml of water, 0.5 ml of New England Biolabs Buffer no. 3, and 1.5 ml of AciI enzyme (10 units/ml; New England Biolabs), and digested at 37°C for 2 h. A sample pooled from 3.5 ml of each individual tissue PCR was mock digested in parallel.Supporting Discussion
Imprinting Assay. A somewhat unusual allele-of-origin assay was described in the work by Hirotsune et al. (1), which suggested that Mkrn1-p1 was imprinted (1). First, the Mkrn1-p1 pseudogene from two independent laboratory strains (FVB and C3H) of mice and two wild subspecies (Mus spretus and Mus molossinus) of mice were sequenced, to identify restriction fragment length polymorphisms (RFLPs) in Mkrn1-p1 (1). The authors then generated two sets of reciprocal F1 hybrid mice from crosses of laboratory strains with wild mice (FVB mated with M. spretus and C3H mated with M. molossinus); therefore, in each of these crosses, the F1 offspring would inherit distinguishable RFLP alleles from the dam and sire. Amplification of Mkrn1-p1 transcripts by RT-PCR, if these transcripts existed, was followed by cloning of the PCR products and subsequently by digestion with the polymorphic enzymes HindIII and BglII (1), to produce predictably distinct fragments corresponding to whichever parental allele was transcribed. Cloned RT-PCR products with restriction patterns that are equally represented between parental RFLP alleles will be non-imprinted. In contrast, unequal representation of the two RFLP patterns, with clones derived exclusively or predominantly from one parent, would be indicative of imprinting. The latter pattern with predominantly the paternal allele expressed is what was reported for Mkrn1-p1, an apparently excellent match to the preferential paternal, and therefore imprinted, transmission of the sxl transgenic phenotype (1).
Importantly, the imprinting assay of Hirotsune et al. (1) appears to have been done very rigorously: not only did they use two types of reciprocal F1 crosses for a total of four crosses, but, for each embryo in each cross, they also analyzed 192 independent PCR clones by restriction enzyme polymorphism analysis. Further, they repeated each of the experiments five times with independent embryos. From their description of this data set (1), it thus appears that they cloned on the order of 4,000 PCR products and performed restriction enzyme digests on all these, a nontrivial task.
The integrity and ability of this assay (1) to demonstrate imprinted expression of Mkrn1-p1 is predicated on three levels of specificity: (i) that it amplifies the correct target gene, (ii) that it exploits predetermined sequence differences to distinguish subspecies/parental origin of the transcripts, and (iii) that it amplifies cDNA derived from RNA, and not from genomic DNA that contaminates the RNA preparation. It is clear that the first requirement was not met, because the PCR primers used as the basis for the claim of Mkrn1-p1 imprinting (1) improperly show a closer match to Mkrn1, having six Mkrn1-p1 mismatches, but only one Mkrn1 mismatch (Fig. 2A, primer set 1). It may also be noted that there is no match at all between these PCR primers and the distantly related and imprinted Mkrn3 gene (4). Indeed, we demonstrated that other PCR primers that more closely match Mkrn1-p1 than Mkrn1 nevertheless only amplified Mkrn1-sequences in RT-PCR assays from kidney RNA (Fig. 2 A and D). Therefore, the only expressed sequence that could have been amplified in the RT-PCR imprinting assay of Hirotsune et al. (1) was Mkrn1, not Mkrn1-p1.
As to the second requirement, it is incomprehensible that amplified Mkrn1 products (as must have been generated with this primer set) could generate the same subspecies-specific restriction fragment length profiles that were expected for the Mkrn1-p1 sequence. Indeed, the BglII (B) and HindIII (H) profiles for Mkrn1 in M. musculus (B-, H+) and M. spretus (B+, H+) are different from the profiles for Mkrn1-p1 in these mice (B+, H- for M. musculus and B-, H- for M. spretus) (sequences from ref. 5). It should be noted that these restriction sites are in the 5' half of the M. spretus sequence (5), which is unambiguously correct (see Discussion). Therefore, because the RT-PCR assay as described (1) could only have amplified Mkrn1 (see above), the imprinting data set (1) could potentially be explained if Mkrn1 was imprinted, and if the authors misinterpreted which gene (Mkrn1-p1 or Mkrn1) was identified by the detected RFLPs. However, since we clearly demonstrated that Mkrn1 is not imprinted (Fig. 3), improper clone identification cannot explain the previously published imprinting data.
As to the third requirement, because Mkrn1-p1 cDNAs were not amplified, one possibility is that Mkrn1-p1 genomic DNA contaminants in the RNA were amplified before RFLP analysis. This argument is unlikely to provide an explanation for the data for two reasons. First, amplification of F1 DNA would be expected to produce an equal number of products from each parental allele. Unequal amplification of parental alleles would occur only if the cognate priming sites had differences in priming efficiency due to sequence changes between the two mouse strains. However, the same number of mismatches exists between the PCR primers (1) and their cognate sites in M. musculus vs. M. spretus Mkrn1-p1 sequences (from ref. 5). Even if there were some bias toward preferential PCR of either the M. musculus or the M. spretus allele, analysis of reciprocal crosses (1) would not follow a pattern based on the gender of the parent but would depend solely on the strain of origin. Second, even if genomic DNA were present in the RNA preparations used for the imprinting assay (1), the primers used were a better match for Mkrn1 than for Mkrn1-p1 (one vs. six mismatches); therefore, because Mkrn1 is highly expressed, the assay would have amplified Mkrn1 cDNA, not Mkrn1-p1 from contaminating genomic DNA.
Therefore, it is implausible that a large data set could be derived by RT-PCR performed with mismatched amplification primers of a pseudogene that is not transcribed, followed by RFLP analysis specific for the nontranscribed pseudogene. It is highly coincidental that the allelic expression ratio (i.e., ≈90% paternal, ≈10% maternal) reported in this data set approximates the degree of imprinted phenotypic penetrance (i.e., 90%) observed for the mutant mice (1). These data cannot be explained, whether on a scientific or artifactual basis.
The Region Putatively Deleted in sxl Transgenic Mice (1) Contains Conserved Noncoding Sequences (CNSs).
Although future work will be required to determine how the sxl transgene insertion/deletion causes the reported phenotype (1), assuming that the molecular analysis of this transgenesis event (1) is correct, we can propose more conventional cis-acting mechanisms (discussed further below). Within the 7-kb region that was stated to be deleted upon sxl transgene insertion (1), we identified CNSs that map to the orthologous region in rat, human, rabbit, cow, dog, elephant, and hedgehog (Fig. 10A). Therefore, CNS elements removed during the insertion/deletion event may be responsible for the dysregulation of another gene or other genes in this region. Indeed, phylogenetic footprinting (6-8) identifies elements within these CNS regions that may represent functional cis-elements for unidentified trans-factors (Fig. 10B and data not shown).Models to Account for the Kidney and Bone Phenotypes of sxl Transgenic Mice.
Because our work has demonstrated that neither Mkrn1-p1 nor Mkrn1 has a causative role in the osteogenesis imperfecta or polycystic kidney disease of sxl transgenic mice (1), we can provide here several scientific explanations that individually or together might account for the phenotype of the original sxl transgenic line (1). Our phylogenetic comparison revealed the presence of three distinct CNSs within the region putatively deleted in the sxl transgenesis (Figs. 5 and 10). A growing body of data has shown that such CNSs often contain cis-acting elements that influence the regulation of expression of nearby, or even distant and noncontiguous, flanking genes (9-13). Accordingly, we propose that removal of conserved cis elements in the sxl transgenic mice (1) led to deletion of an enhancer or silencer that normally regulates expression of an unknown flanking gene (or genes) important for proper kidney and bone development (Fig. 5). An alternative (but not mutually exclusive) mechanism is that insertion of novel transcriptional elements driving the sxl transgene introduced elements that led to the inappropriate expression of a neighboring endogenous gene (or genes), given that such effects have been documented to occur even up to 1 Mb away (12, 14). Finally, because the Pkd2 (polycystic kidney disease 2) gene is also localized to chromosome 5, ≈15.5 Mb away from the putative sxl transgenic insertion site (1) (Figs. 5 and 6), more complex chromosome rearrangements including an inversion (ref. 15) could lead to dysregulation of Pkd2. Under this model, the latter could negatively impact the functional interaction of Pkd2 with Pkd1, with defects in Pkd1 known to lead to skeletal malformations in addition to polycystic kidney disease (16). In conclusion, future cytogenetic, molecular and/or phenotypic studies on sxl transgenic mice (1) are necessary to distinguish between these or unidentified possibilities to reveal the correct mechanisms that are responsible for the disease phenotype.1. Hirotsune, S., Yoshida, N., Chen, A., Garrett, L., Sugiyama, F., Takahashi, S., Yagami, K., Wynshaw-Boris, A. & Yoshiki, A. (2003) Nature 423, 91-96.
2. Findlater, G. S., McDougall, R. D. & Kaufman, M. H. (1993) J. Anat. 183, 121-129.
3. Miettinen, P. J., Berger, J. E., Meneses, J., Phung, Y., Pedersen, R. A., Werb, Z. & Derynck, R. (1995) Nature 376, 337-341.
4. Jong, M. T., Carey, A. H., Caldwell, K., Lau, M. H., Handel, M. A., Driscoll, D. J., Stewart, C. L., Rinchik, E. M. & Nicholls, R. D. (1999) Hum. Mol. Genet. 8, 795-803.
5. Podlaha, O. & Zhang, J. (2004) Mol. Biol. Evol. 21, 2202-2209.
6. Duret, L. & Bucher, P. (1997) Curr. Opin. Struct. Biol. 7, 399-406.
7. Gumucio, D. L., Heilstedt-Williamson, H., Gray, T. A., Tarle, S. A., Shelton, D. A., Tagle, D. A., Slightom, J. L., Goodman, M. & Collins, F. S. (1992) Mol. Cell. Biol. 12, 4919-29.
8. Zhang, Z. & Gerstein, M. (2003) J. Biol. 2, 11.
9. Ahituv, N., Rubin, E. M. & Nobrega, M. A. (2004) Hum. Mol. Genet. 13, Spec. No. 2, R261-R266.
10. Loots, G. G., Locksley, R. M., Blankespoor, C. M., Wang, Z. E., Miller, W., Rubin, E. M. & Frazer, K. A. (2000) Science 288, 136-140.
11. Nobrega, M. A., Ovcharenko, I., Afzal, V. & Rubin, E. M. (2003) Science 302, 413.
12. Stefan, M., Claiborn, K. C., Stasiek, E., Chai, J. H., Ohta, T., Longnecker, R., Greally, J. M. & Nicholls, R. D. (2005) BMC Genomics 6, 157.
13. Woolfe, A., Goodson, M., Goode, D. K., Snell, P., McEwen, G. K., Vavouri, T., Smith, S. F., North, P., Callaway, H., Kelly, K., et al. (2004) PLoS Biol. 3, e7.
14. Qin, Y., Kong, L. K., Poirier, C., Truong, C., Overbeek, P. A. & Bishop, C. E. (2004) Hum. Mol. Genet. 13, 1213-1218.
15. Smiraglia, D. J., Wu, C., Ellsworth, M. K., Ratty, A. K., Chapman, V. M. & Gross, K. W. (1997) Genomics 45, 572-579.
16. Boulter, C., Mulroy, S., Webb, S., Fleming, S., Brindle, K. & Sandford, R. (2001) Proc. Natl. Acad. Sci. USA 98, 12174-12179.