Morton et al. 10.1073/pnas.0606377103. |
Fig. 5. Classification tree from 2004 field training data and Moderate Resolution Imaging Spectroradiometer (MODIS) phenology mean, median (med), maximum (max), amplitude (amp), standard deviation (stdv), and harmonic amplitude metrics. Normalized difference vegetation index (NDVI) or enhanced vegetation index (EVI) threshold values are located beneath each node, shown as (NDVI or EVI) [times] 10,000.
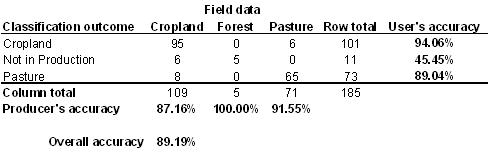
Table 1. Validation of 2004 classification tree using field data and MODIS metrics from 2005
Per-polygon accuracy compares the majority classification within each validation polygon to field observations. Forest training data were used to identify deforested areas not yet in production, including damaged forests that were never fully cleared (e.g., logged or burned forest), edge effects from adjacent forest cover, and regrowth.
Table 2. Adjustments to the land-cover classification of the first year after 2001, 2002, and 2003 annual deforestation based on patterns in land cover trajectory
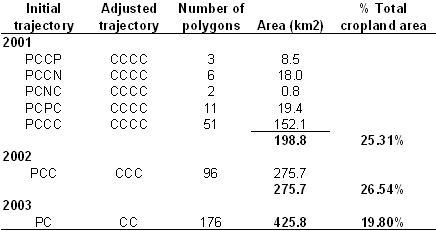
C, cropland; N, not in production; P, pasture.