Principles of ESP
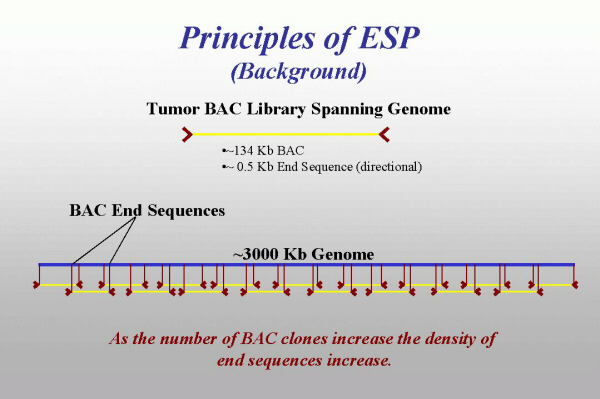
ESP begins with construction of a BAC library from tumor DNA (see Fig. 5). In our MCF7 library, each BAC clone has an insert of average size of 134 kb (±20 kb). Of these 134 kb or so, only ends are sequenced (≈500–1,000 bp on both sides). These end sequences can be mapped back to the genome that was used to generate BAC library, thus becoming essentially sequence-tagged sites (STSs). Moreover, because the structure of BAC vector used for cloning is known, we know, that in the absence of genome aberrations BESs, originating from the same BAC clone, should be oriented toward each other and separated by a distance, equal to the size of the insert in this clone.
Obviously, as the number of end-sequenced BACs increases, the density of the markers, derived from their BES increases.
Fig. 5.
How can BESs be used for elucidation of the structure of tumor genome? Our approach is based on the fact that availability of the draft assembly of human genome sequence makes it possible to map tumor BES onto this assembly, using robust sequence comparison tools. Analysis of the results of this mapping shows that all types of genome rearrangements can be detected. For example, copy number plot of tumor genome can be constructed based on the fact that BAC library construction is essentially random process. Thus the number of BACs, representing a genomic region is proportional to the copy number of this region in the tumor genome. Thus, when tumor BES are mapped onto normal genome, in the regions, where the copy number is the same, the density of BES will be at some average level. However, in the regions of increased copy number, a stacking of tumor BES will be observed, whereas deleted regions can be detected by the decrease in the density of BES.
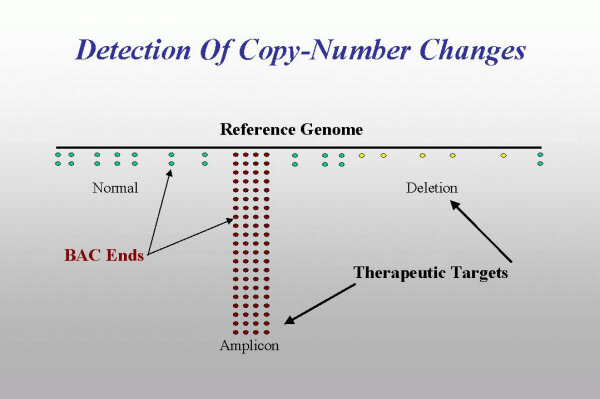
Fig. 6.
In addition to copy number data, use of the information on orientation and relative position of tumor BES mapped onto normal genome is a powerful indicator of tumor genome structure. In the regions where the normal and tumor genomes are colinear, the orientation and spacing of the map positions of tumor BES will correspond to the expected for a given library (yellow clones on Fig. 7). In this case apparent BAC size (defined as a distance between map positions of its BES on the normal genome) will be equal to a real BAC size (the physical size of its insert). In the case of inversion two regions of the chromosome that were separated by a large distance are brought together. Thus they can both fit onto a single BAC. This tumor BAC will have a real size within a distribution of insert sizes characteristic for a given library, but apparent size of this BAC will be very different (blue clone on Fig. 7). Similarly, translocations and other interchromosomal rearrangements bring together DNA from different chromosomes and can be detected by BACs with ends mapping to different chromosomes.

Fig. 7.
Additional data and detailed description of computer modeling are available at http://shark.ucsf.edu/%7Estas/NCI_ESP/index.html.