Blood, Vol. 109, Issue 4, 1451-1459, February 15, 2007
Expression analysis of primary mouse megakaryocyte differentiation and its application in identifying stage-specific molecular markers and a novel transcriptional target of NF-E2
Blood Chen et al. 109: 1451
Supplemental materials for: Chen et al, Vol 109, Issue 4, 1451-1459
Files in this Data Supplement:
- Table S1. Results of gene-ontology (GO) analysis on genes that fall into group 1 in self-organizing maps (PDF, 49.1 KB) -
Functional pathways significantly enriched in hierarchical clustering of group 1 genes, listed according to the fractional representation of a given pathway (GO term) in the group and the fractional representation of genes from that pathway in the whole group. These 2 variables combine to assign the rank for pathway enrichment in group 1. - Table S2. GO classification of genes that fall into group 2 in self-organizing maps (PDF, 36.6 KB) -
Functional pathways significantly enriched in hierarchical clustering of group 1 genes, listed according to the fractional representation of a given pathway (GO term) in the group and the fractional representation of genes from that pathway in the whole group. - Table S3. GO classification of genes that fall into group 3 in self-organizing maps (PDF, 21.7 KB) -
Functional pathways significantly enriched after hierarchical clustering of group 3 genes, listed according to the fractional representation of a given pathway (GO term) in the group and the fractional representation of genes from that pathway in the whole group. These variables combine to assign the rank for pathway enrichment in group 3. - Table S4. Oligonucleotide primers used for PCR in this study (PDF, 23.8 KB)
- Figure S1. Self-organizing map (SOM) derived from the MK expression data (JPG, 43.2 KB) -
Hierarchical clustering of genes identified by SOMs and showing peak expression in MK progenitors, MK-P (A; group 1); MKs of intermediate maturity, MK-3 (B; group 2); or MKs showing advanced cytomorphologic differentiation, MK-6 (C; group 3).
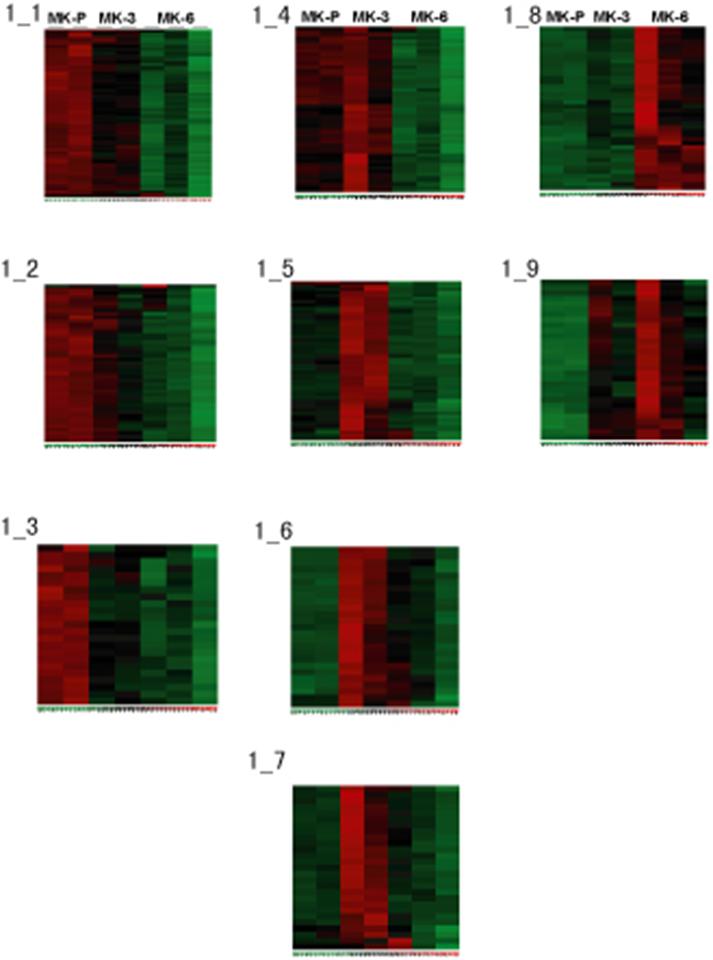
- Figure S2. Quality threshold (QT) clustering of genes showing significant differential expression by ANOVA analysis (JPG, 43.6 KB) -
Expression patterns of the 9 significant clusters identified by QT clustering are shown. Three clusters (1, 2, and 3) show declining expression with MK differentiation; 4 clusters (4, 5, 6, and 7) peak in the MK-3 population; and 2 clusters (8 and 9) show highest average expression in MK-6.
- Figure S3. GO classification of gene clusters identified by QT clustering (JPG, 93.3 KB) -
Enriched functional and signaling pathways are shown. Analysis was done using dChip software.
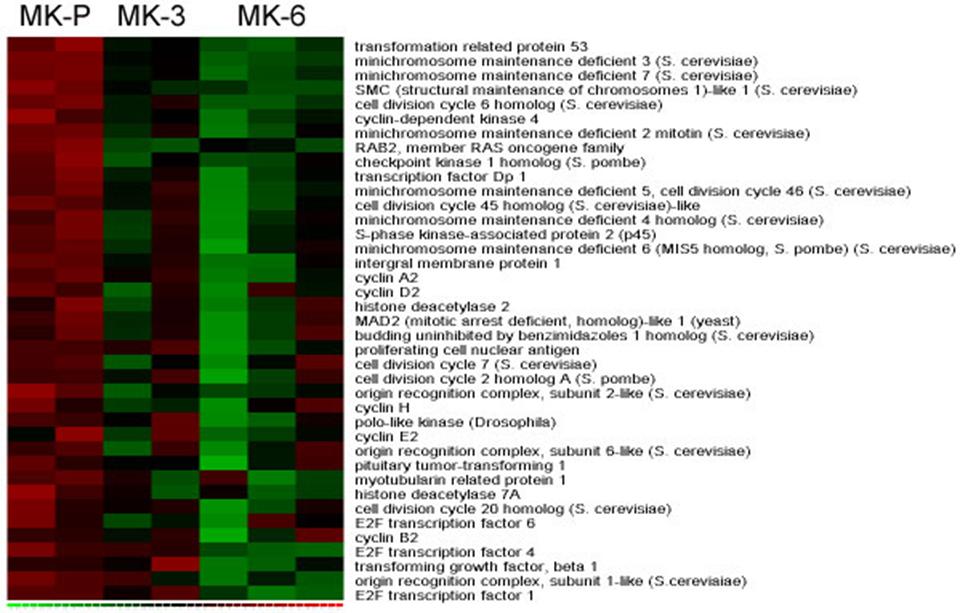
- Figure S4. Cell cycle–related genes identified in MK-P by gene set enrichment analysis (JPG, 83.7 KB) -
Hierarchical clustering of genes showing core enrichment in cell-cycle pathways, as identified by GSEA. The green-red gradient indicates expression level, where green represents low and red reflects high expression.
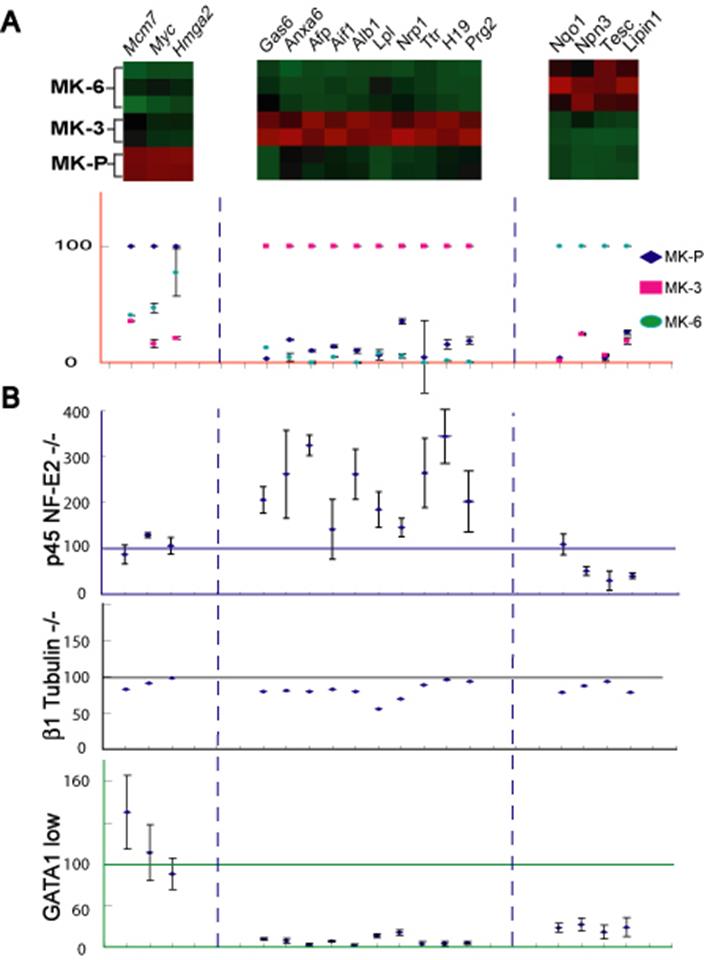
- Figure S5. Complete representation of expression of molecular markers of stages in MK maturation in mouse models of thrombocytopenia (JPG, 50.9 KB) -
Replicate of Figure 3 with error bars shown for the qRT-PCR data.