
Pero et al. 10.1073/pnas.0700185104. |
Fig. 5. Messenger RNAs representing each of the Gai family members are present in peripheral blood eosinophils. Peripheral blood eosinophils from IL-5 transgenic mice (line: NJ.1638; ref. 13) were purified (>98.5%) using methodologies described (1). RT-PCR assays were performed using primer sets specific for Gai1, Gai2, and Gai3 (2). Primers for the olfactory/neuronal-specific G protein Gao were used as a negative control sample (3). In each set of samples, lane 1 represents PCR amplicons derived from RT-PCR of peripheral blood eosinophil RNA; lane 2 corresponds to negative control assays performed with peripheral blood eosinophil RNA without reverse transcriptase in the RT portion of the reaction process; and lane 3 represents positive control reactions using brain RNA, which was previously shown to express all of the G proteins examined (4). M, double-stranded DNA marker.
References
1. Shen HH, Ochkur SI, McGarry MP, Crosby JR, Hines EM, Borchers MT, Wang H, Biechele TL, O'Neill KR, Ansay TL, et al. (2003) J Immunol 170:3296-3305.
2. Jiang M, Spicher K, Boulay G, Martin-Requero A, Dye CA, Rudolph U, Birnbaumer L (2002) Methods Enzymol 344:277-298.
3. Jiang M, Gold MS, Boulay G, Spicher K, Peyton M, Brabet P, Srinivasan Y, Rudolph U, Ellison G, Birnbaumer L (1998) Proc Natl Acad Sci USA 95:3269-3274.
4. Dolphin AC (2003) Pharmacol Rev 55:607-627.

Fig. 6. OVA-induced tissue accumulation of eosinophils was significantly reduced in Gai2-/- mice relative to wild-type animals. Assessments of eosinophils infiltrating the lung were performed by immunohistochemistry using a rabbit polyclonal anti-mouse major basic protein (MBP) antisera (1). (A) Representative photomicrographs of lung sections from OVA-treated wild-type and Gai2-/- mice after immunohistochemistry staining for the presence of MBP+ cells (i.e., eosinophils). (Scale bar: 100 mm.) (B) Quantitative assessments of the peribronchial areas demonstrated a >70% decrease in the density of tissue eosinophils (i.e., eosinophils per mm2) in OVA-treated Gai2-/- mice relative to wild-type animals (mean ±SEM; n = 5 mice per group). *, P < 0.05.
Reference
1. Lee JJ, McGarry MP, Farmer SC, Denzler KL, Larson KA, Carrigan PE, Brenneise IE, Horton MA, Haczku A, Gelfand EW, et al. (1997) J Exp Med 185:2143-2156.
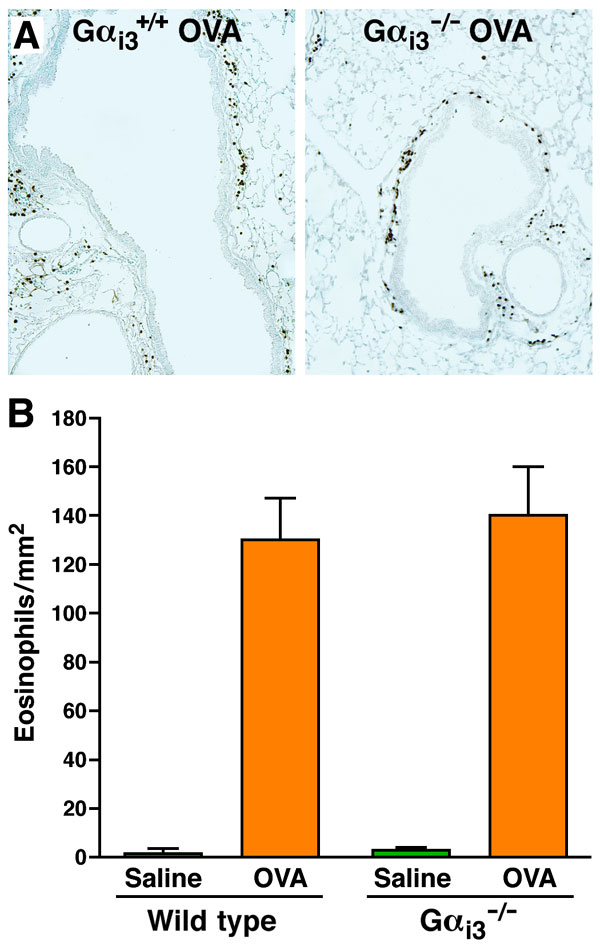
Fig. 7. OVA-induced tissue accumulation of eosinophils was unaffected in Gai3-deficient mice relative to wild-type animals. (A) Representative photomicrographs of lung sections stained for the presence of MBP+ cells (i.e., eosinophils). (B) Quantitative assessments of the number of eosinophils infiltrating peribronchial areas (i.e., eosinophils per mm2) demonstrated that no statistical difference exists between OVA-treated Gai3-/- and wild-type mice (mean ± SEM; n = 5 mice per group).

Fig. 8. Eosinophils adoptively transferred into the peritoneal cavity of OVA-sensitized wild-type mice are recruited to the lungs after OVA aerosol provocation. (A) Adoptively transferred CFDA+ eosinophils accumulate in the lungs of OVA-sensitized mice as a function of time with a kinetic maximum at 24 h post provocation (WT OVA). Adoptive transfer of eosinophils into saline-sensitized/OVA aerosol-challenged mice (WT Naive) was used as negative controls. *, P < 0.05. (B) Fluorescent photomicrographs of lung sections from allergen naive (WT Naive) and OVA-sensitized/aerosol-challenged (WT OVA) wild-type mice 24 h after OVA challenge and adoptive transfer of CFDA+ eosinophils. Arrows indicate pulmonary tissue eosinophils. B, bronchiole; AS, alveolar space.

Fig. 9. Adoptive transfer of wild-type vs. Gai2-/- eosinophils into OVA-treated wild-type recipients demonstrated that in vivo trafficking of Gai2-/- eosinophils to the lungs is enhanced relative to wild-type eosinophils. Representative photomicrographs of lung sections stained for the presence of eosinophils (i.e., immunohistochemistry with a rabbit polyclonal anti-mouse MBP antisera, dark brown staining cells) showed that OVA-induced accumulation of eosinophils was significantly enhanced as a consequence of adoptively transferring Gai2-deficient eosinophils (i.e., relative to transferring wild-type eosinophils) to recipient wild-type mice (n = 5 mice per group) before the OVA aerosol challenges. (Scale bar: 100 mm.)
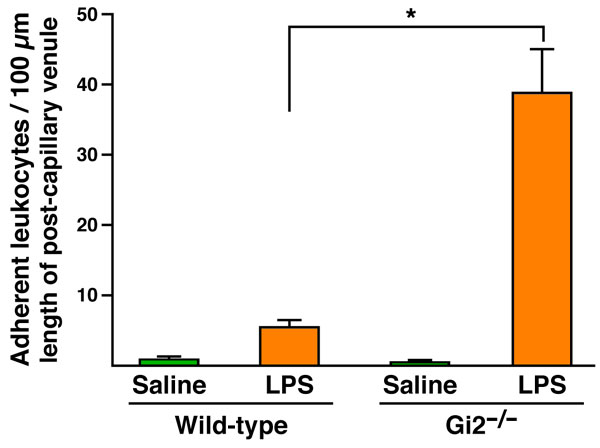
Fig. 10. The loss of Gai2 signaling in the vascular endothelium leads to the accumulation of immobilizing cells in postcapillary venules. The quantification of endothelium-bound leukocytes in video images demonstrated that stationary leukocytes increased by >7-fold relative to wild-type controls (n = 3-4 mice per group). *, P < 0.05.

Fig. 11. Pertussis toxin pretreatment of mHEVa endothelial cells does not induce cytotoxicity and/or a decrease in cell viability. The mHEVa monolayers were grown to 95% confluence on slides and treated overnight with the indicated concentrations of pertussis toxin (endothelial cells grew to confluence in all groups as observed by microscopy). (A) Cell viability, as measured by release of GAPDH into the media, was determined using a Molecular Probes Vybrant Cytotoxicity Assay Kit. (B) Death of the mHEVa cells was assessed by microscopy after dissociation of the monolayer (0.3% EDTA) using a trypan exclusion assay. "No treatment," endothelial cells treated with PBS.

Fig. 12. Pertussis toxin pretreatment of mHEVa endothelial cells had no effect on either the level of VCAM-1 expression on cells or the number of cells expressing VCAM-1. mHEVa monolayers (95% confluent) were grown on slides and treated overnight with the indicated concentrations of pertussis toxin (endothelial cells grew to confluence in all groups as observed by microscopy). Pertussis toxin treated monolayers were disassociated with 0.3% EDTA in preparation of flow cytometric assessment of VCAM-1 expression. (A) The level of VCAM-1 per cell was assessed (mean fluorescence intensity) as a function of increasing pertussis toxin exposure. (B) The number of VCAM-1-expressing cells was determined as a percent of total cells after exposure to increasing concentrations of pertussis toxin. "No treatment,", endothelial cells treated with PBS.
Movie 1. Leukocyte-endothelial cell interactions in WT and Gαi2-/- mice after systemic administration (i.p.) of LPS. Post capillary venules of the mesentery vasculature were observed and documented by intravital video microscopy. The movie is a compilation of video clips from LPS-treated WT (WT/LPS) and Gαi2 knockout (Gαi2-/-/LPS) mice (two video clips per genotype). These video clips are representative of the data presented in SI Figure 10, quantifying the extent leukocytes remain immobilized on the endothelial surface of the mesentery vasculature. Green arrows highlight immobilized leukocytes following exposure to LPS, and yellow arrows identify previously stationary cells that spontaneous become mobile (i.e., reenter circulation). The time clock in the lower right of the frame provides a measure of the real time of each video clip.
SI Materials and Methods
Induction of Allergic Airway Inflammation.
The OVA model of allergic pulmonary inflammation has been described (1). Briefly, mice (20-30 grams) were sensitized by an i.p. injection (100 ml) of 20 mg of chicken ovalbumin (OVA; Sigma, St. Louis, MO) emulsified in 2 mg of Imject Alum [Al(OH)3/Mg(OH)2; Pierce, Rockfield, IL] on days 0 and 14. Mice were subsequently challenged with an aerosol of 1% OVA in saline (OVA) or saline alone (SAL) on days 24, 25, and 26. In some cases, cell-free BAL fluids were flash-frozen in liquid nitrogen and stored at -80°C before cytokine level determination by ELISA. Eosinophil accumulation in the airway lumen was assessed by enumerating BAL leukocytes at defined times during the allergen challenge phase of this protocol.Isolation of Mouse Eosinophils.
Eosinophils were isolated and purified from tail vasculature-derived blood of IL-5 transgenic mice (NJ.1638) (2) and compound IL-5 transgenic animals also deficient of either Gai2-/- or Gai3-/-. Total cell counts were acquired using a hemocytometer and cell differentials were performed from cytospin preparations counting >300 cells. Heparinized blood was layered onto a Percoll E gradient [60% Percoll E (r = 1.084), 1´ HBSS, 15 mM Hepes (pH 7.4)] and centrifuged (45 min, 2,000 ´ g, 4°C). Eosinophil-enriched interface leukocytes were recovered and washed twice in PBS containing 2% FCS. Eosinophils were isolated using a magnetic cell separation system (MACS; Miltenyi Biotech, Auburn, CA) through the removal of contaminating B cells and T cells by positive selection with antibody-conjugated magnetic beads specific for CD45-R (B220) and CD90 (Thy 1.2), respectively.Isolation of Splenocytes.
Total splenocytes were isolated from wild type, Gai2-/-, and Gai3-/- mice as described (3). Briefly, spleens were diced into small sections and sheared through 18-, 20-, and 22-gauge needles in RPMI 1640 medium containing 10% FCS, penicillin (100 units/ml), and streptomycin (100 units/ml) and filtered through a 40-mm screen. The red blood cells were lysed in ice-cold distilled water for 20 seconds, and the final preparation of splenocytes was resuspended in the RPMI. Total cell counts were acquired using a hemocytometer and cell differentials were performed from cytospin preparations counting >300 cells.In Vitro
Assessment of Leukocyte Chemotaxis. Chemotaxis of isolated leukocytes was assessed in vitro using a transwell assay format as described (4). In some experiments using purified eosinophils, freshly isolated eosinophils were pretreated with 1-1,000 ng/ml Pertussis toxin (Sigma) for 2 h (37°C and 5% CO2) before use in the transwell chemotaxis assays. Chemotaxis was expressed as a migration index (MI) assessing the number of cells migrating in response to chemoattractant relative to the number of cells migrating in response to media alone. Baseline migration in all assays (i.e., nonspecific movement) was not significantly different (~1 ´ 104 cells) among the different samples examined.Eosinophil Adoptive Transfer.
Purified wild-type and Gai2-/- eosinophils were resuspended in RPMI in preparation for adoptive transfer into OVA-treated wild-type recipient mice. 1 ´ 107 eosinophils were adoptively transferred to OVA-treated wild-type mice via the i.p. cavity (200:l) on days 25, 26, and 27 of the OVA protocol (5, 6). BAL eosinophil counts were assessed 24 h after the last transfer.Ex Vivo
Labeling of Eosinophils and Monitoring the Recruitment/Accumulation of Labeled Eosinophils After Adoptive Transfer to the Peritoneal Cavity. The fluorescent marker, carboxylfluorescein diacetate (CFDA), was used to label purified peripheral blood mouse eosinophils as per the manufacturer's instructions (Molecular Probes, Eugene, OR). Freshly purified eosinophils (1-5 ´ 107) were resuspended gently in prewarmed PBS containing 10 mM CFDA and incubated for 15 min at 37°C. The cells were centrifuged, resuspended in fresh prewarmed RPMI 1640, and incubated for another 30 min at 37°C. The CFDA-labeled eosinophils were washed and subsequently maintained in sterile endotoxin-free PBS at room temperature before use. Examination of these eosinophils using fluorescence microscopy and standard fluorescein filter sets demonstrated that 100% of the cells were CFDA+. In addition, trypan blue exclusion showed that >99% of CFDA-labeled cells remained viable. CFDA+ eosinophils in the peribronchial/perivascular regions were enumerated (cells/mm2) in frozen sections (10 mm) following fixation of the lung in 2% paraformaldehyde for 1 h at 4°C followed by infusion with 30% sucrose overnight (OCT-embedded; Sakura Fineteck U.S.A. Inc., Torrance, CA). CFDA+ eosinophils were identified in these sections by fluorescence microscopy using a fluorescein filter set.In Vivo
Assessment of Leukocyte Intra-Capillary Rolling and/or Adhesion in Postcapillary Venules by Intravital Microscopy. Briefly, 4 hours after i.p. administration of LPS (10 mg in 100 ml saline/animal), mice were anesthetized with a s.c. injection of saline solution containing a mixture of ketamine hydrochloride and xylazine (7.5 mg and 2.5 mg, respectively, per 100 mg of body weight). The anesthetized animals were administered 200 ml of acridine orange (2 mg/ml in 1´ PBS), and the mice were placed on a heating pad maintained at 37°C. A midline incision was made, and the small intestine was gently exteriorized and spread on a heated glass window (37.5°C) of the stage of a Leitz intravital microscope (Wetzlar, Germany). The exteriorized portion of mesentery and small intestine were kept continuously moist with endotoxin free isotonic saline solution (pH 7.4). In addition, the other segments of the intestine that were exposed, but not microscopically observed, were kept moist with isotonic saline soaked cotton pads and the mesentery was covered with Saran Wrap. To minimize endotoxin contamination, the Saran Wrap was presoaked with 1% E-Toxa-Clean (Sigma Chemical Co.) overnight, followed by rinsing in 70% ethanol, endotoxin free distilled water, and a final wash with sterile isotonic saline solution.All images were recorded through a silicone intensified tube camera (SIT68; DAGE MTI, Michigan City, IN) attached to the microscope and connected to a monitor (Panasonic) and an S-VHS video recorder (HC-6600; JVC, Tokyo, Japan) using a Nikon 10´ or a Leitz 25´ water immersion objective. Leukocytes visibly interacting with the microvascular endothelium and passing at a slower rate than the main blood stream were considered as rolling cells. Rolling cells were quantified by counting the number of leukocytes interacting with the vessel wall in 1 min in a plane perpendicular to a vessel axis relative to total number of cells in the vessel. Leukocytes remaining stationary for >30 sec were considered as adherent cells and quantified as the number of adherent cells/100 mm length of a postcapillary venule.
Ex Vivo
Assessments of Lymphocyte Adhesion, and Migration. Reagents: Rat anti-mouse VCAM-1 (clone MVCAM.A) was purchased from BD PharMingen (San Diego, CA) and anti-a4 integrin (clone PS/2) was purchased from BioDesign International (Kennebunk, ME). Pertussis toxin was obtained from Sigma.Cells.
The endothelial cell line mHEVa was previously derived from BALB/c mouse auxiliary lymph nodes and cultured as described (7-12). The mHEVa cells have been spontaneously immortalized but are not transformed (7). mHEVa cell monolayers were grown to 95% confluence on slides and treated overnight with media containing pertussis toxin (endothelial cells grew to confluence in all groups as observed by microscopy) and washed five times before inserting the slide in the parallel plate flow chamber. For spleen cells, single cell suspensions were obtained from spleens of male 6- to 8-week-old BALB/c mice (Harlan Industries, Indianapolis, IN) as described (8), and the red blood cells were lysed by hypotonic shock (7). These animal procedures were reviewed and approved by the Animal Care and Use Committee at Northwestern University.Cell Viability and Cytotoxicity Assays.
Endothelial cell viability after all treatments was determined either by assessment of GADPH release into the medium using the Molecular Probes Vybrant Cytotoxicity Assay Kit (V-23111; Carlsbad, CA) or by microscopic assessment of cells following disassociation with 0.3% EDTA using trypan blue exclusion.Adhesion, Rolling, and Migration under Laminar Flow
. A parallel plate flow chamber was used to examine migration under conditions of laminar flow. Spleen cells were used as a source of cells contiguous with the blood stream that could then migrate across endothelial cells. Spleen cell migration across the mHEVa cell lines is stimulated by mHEVa cell constitutive production of the chemokine MCP-1 (12) and is dependent on adhesion to VCAM-1 (8). We have previously reported that after migration across the mHEVa cells, the spleen cells are 65-70% B cells, 12-15% CD4+ cells, and 5-8% CD8+ cells (13). For this migration assay, endothelial cells were grown to confluence on slides and then the slide was placed in a parallel plate flow chamber (14). Spleen cells (3 ´ 106) were added to the flow chamber (3.5 cm2) at 2 dynes/cm2. In vivo, in the absence of inflammation, the rapid fluid dynamics of the blood result in blood cells located midstream of the vascular flow (15). However, during inflammation, there is a change of fluid dynamics (15-17). With inflammation, vascular permeability increases yielding fluid flow from the blood into the tissues which likely contributes to contact of blood cells with the endothelium ("margination") (15, 16). There is also cell contact as the blood cells leave the capillaries and enter the postcapillary venules (17). Therefore, to initiate spleen cell contact with the endothelial cells in vitro, the spleen cells were allowed to settle in the chamber as determined by microscopy and then 2 dynes/cm2 was applied for the 15-min laminar flow assay. We have observed by microscopy that during the assay under laminar flow, the spleen cells in contact with the endothelial cells either roll, roll and detach, or roll, firmly attach and migrate. After cell contact, the focus of the studies is on mechanisms of transendothelial migration under conditions of laminar flow. For this assay, the coculture was exposed to laminar flow at 2 dynes/cm2 at 37°C for 15 min to examine cell migration. The cells are washed at 2 dynes/cm2 and then fixed with 3% paraformaldehyde for 1 h. Spleen cell migration is detected by 15 min in the laminar flow assay. It has been reported that the migration of an individual leukocyte, after it has rolled to a site of migration, occurs in 2 min. Furthermore, transendothelial migration of leukocytes is asynchronous. To quantify migrated spleen cells at 15 min, phase contrast microscopy was used to count migrated cells that are phase dark (18). The number of spleen cells that were associated with the endothelium but have not traversed this monolayer [i.e., not migrated (phase light cells)] at 15 min is low because in this time frame the majority of non-migrating cells roll off the monolayer of endothelial cells as determined by microscopy (data not shown). Therefore, the number of spleen cells associated with the endothelial cells at 3 min was determined in the Cell Association Assay (13). Briefly, after hypotonic lysis of RBC, spleen cells (50 ´ 106/ml) were loaded with the fluorescent viable dye calcein-AM and washed. The cells settled onto the confluent endothelial cell monolayers (96-well format) in 4 min and adhesion was determined at 2 min. Nonadherent lymphocytes were removed by vortexing gently, and the plates were read on a microplate fluorometer (Cambridge Technology International, Watertown, MA). The number of lymphocytes was calculated using a standard curve of number of lymphocytes versus relative fluorescence.References
1. Borchers MT, Crosby JR, Farmer SC, Sypek J, Ansay TL, Lee NA, Lee JJ (2001) Am J Physiol LCMP 280:L813-L821.
2. Lee NA, McGarry MP, Larson KA, Horton MA, Kristensen AB, Lee JJ (1997) J Immunol 158:1332-1344.
3. Borchers MT, Justice PJ, Ansay TL, Mancino V, McGarry MP, Crosby JR, Simon MI, Lee NA, Lee JJ (2002) J Immunol 168:3543-3549.
4. Borchers MT, Ansay TL, DeSalle R, Daugherty BL, Shen HH, Metzger M, Lee NA, Lee, JJ (2002) J Leukoc Biol 71:1033-1041.
5. Takeda K, Hamelmann E, Joetham A, Shultz LD, Larsen GL, Irvin CG, Gelfand EW (1997) J Exp Med 186:449-454.
6. Shen HH, Ochkur SI, McGarry MP, Crosby JR, Hines EM, Borchers MT, Wang H, Biechele TL, O'Neill KR, Ansay TL, et al. (2003) J Immunol 170:3296-3305.
7. Cook-Mills JM, Gallagher JS, Feldbush TL (1996) In Vitro Cell Dev Biol Anim 32:167-177.
8. Matheny HE, Deem TL, Cook-Mills JM (2000) J Immunol 164:6550-6559.
9. Tudor KS, Deem TL, Cook-Mills JM (2000) Biochem Cell Biol 78:99-113.
10. Deem TL, Cook-Mills JM (2004) Blood 104:2385-2393.
11. Cook-Mills JM, Johnson JD, Deem TL, Ochi A, Wang L, Zheng Y (2004) Biochem J 378:539-547.
12. Qureshi MH, Cook-Mills J, Doherty DE, Garvy BA (2003) J Immunol 171:4700-4707.
13. Tudor KS, Hess KL, Cook-Mills JM (2001) Cytokine 15:196-211.
14. Lawrence MB, McIntire LV, Eskin SG (1987) Blood 70:1284-1290.
15. Nobis U, Pries AR, Cokelet GR, Gaehtgens P (1985) Microvasc Res 29:295-304.
16. Lipowsky HH (2005) Microcirculation 12:5-15.
17. Smith ML, Long DS, Damiano ER, Ley K (2003) Biophys J 85:637-645.
18. Ager A, Mistry S (1988) Eur J Immunol 18:1265-1274.