
Yang et al. 10.1073/pnas.0605779103. |
Fig. 6. Analysis of homo and heterodimerization preferences. (A) Nano-ESI mass spectra of the 14-3-3 isoforms b, e, g, h, and t in aqueous ammonium acetate buffer illustrating the different monomer/(homo-)dimer equilibria. Experimentally found masses (in Da) are for b: 28 075, b2: 56 256, e2: 53 530, g: 29 112, g2: 58 277, h: 28 357, h2: 56 732, t: 26 784, t2: 53 551, t2*: 56 060. t* is the t isoform with the His-tag still attached. (B) Nano-ESI MS analysis of heterodimer formation in equimolar mixtures of two 14-3-3 isoforms. Upper panel: Homo- and heterodimers of b and g show no marked preference for heterodimer formation, with a statistical 1:2:1 intensity ratio of the b2 : b/g : g2 dimers. Lower panel: b and e form almost exclusively heterodimers, as is the case for all mixtures involving the e isoform.

Fig. 7. Superimposition and surface representations of the two closed forms of 14-3-3b looking at the peptide binding groove. The closed apo-b is drawn as a blue net while the widened ExoS-b structure is red. The ExoS peptide is drawn in stick mode with the side-chains color coding the same as in Fig. 4c.
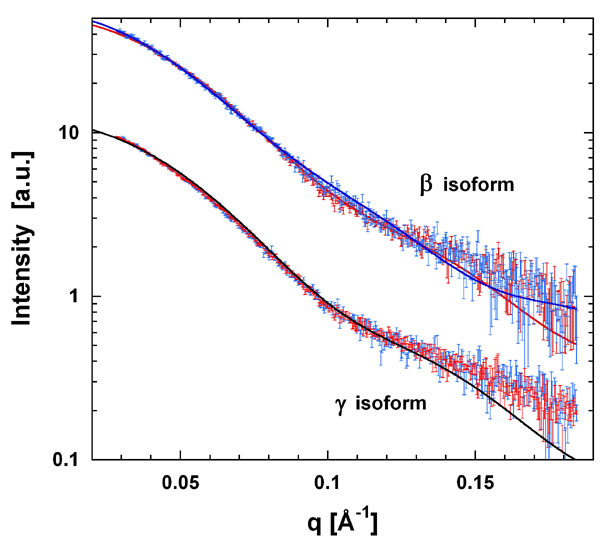
Fig. 8. Experimental x-ray scattering profiles (with error bars) for b and g isoforms in the presence (red) and absence (blue) of peptide. Curves for the two isoforms have been shifted for clarity. Superimposed are the simulated scattering profiles for the closed conformation of b (peptide-bound form, red line) and a fully open apo-b (blue line) as well as the peptide-bound conformation of the g-dimer (black line). Goodness-of-fit (c) values are as follows: apo-b versus fully open model (1.7) and versus closed model (2.0), peptide-bound b versus fully open model (2.5) and versus closed model (2.0); apo-g versus closed model (2.5), peptide-bound g versus closed model (3.5). The goodness-of-fit value (c) is a measure of how well the structure fits the experimental data (a reliable agreement between experiment and simulation is generally obtained for c < 3).
Table 1. Summary of crystallization conditions
Protein Name | Concentration (mg/ml) | Peptide | Reservoir buffer | Protein: Reservoir Ratio |
β | 28 | ExoS | 0.05 M MgCl2 0.1 M HEPES pH 7.5 30 % PEG MME550 | 1:2 |
β | 28 | none | 0.05 M MgCl2 0.1 M HEPES pH 7.5 30 % PEG MME550 | 1:2 |
ε | 34 | Pep1 | 40 % MPD 5 % PEG10000 0.1 M cacodylate pH 6.5 | 1:1 |
γ | 28 | Pep2 | 25 % PEG3350 0.1 Bis/Tris pH 5.5 0.2 M MgCl2 | 1:1 |
τ | 34 | Pep1 | 0.2 M sodium acetate 0.1 M Tris pH 8.5 30 % PEG4000 | 1:1 |
η | 40 | Pep1 | 0.2 M MgCl2 0.1 M HEPES pH 7.5 25 % PEG3350 | 2:1 |
η | 40 | Pep2 | 0.2 M MgCl2 0.1 M HEPES pH 7.5 25 % PEG3350 | 2:1 |
Table 2. Data collection and refinement statistics
Data Collection | Pep1-ε | Pep1-τ | Pep2-γ | Pep1-η | Pep2-η | ExoS-β | apo-β |
Spacegroup | C 2221 | P 21 | P 41212 | P 212121 | P 21 | C2221 | P 21 |
Wavelength (Å) | 0.968 | 1.5418 | 0.9919 | 0.9789 | 0.9718 | 0.9919 | 1.5418 |
Unit Cell (a, b, c (Å), b (°)) | 78.0, 81.5, 81.0 | 61.3, 86.0, 64.7, 112.7 | 121.6, 121.6, 313.2 | 75.7, 75.6, 113.5 | 58.3, 79.4, 125.1, 95.2 | 59.9, 86.8, 121.8 | 51.6, 123.8, 54.6, 115.0 |
Resolution range * (Å) | 36.42-1.75 (1.84-1.75) | 34.88-2.80 (2.95-2.80) | 48.20-2.55 (2.62-2.55) | 37.85-2.70 (2.85-2.70) | 66.96-2.15 (2.27-2.15) | 49.33-2.65 (2.79-2.65) | 38.72-2.50 (2.64-2.50) |
No. of unique observations* | 26178 (3700) | 14743 (2050) | 77602 (7666) | 18419 (2627) | 61914 (8967) | 9558 (1364) | 21068 (3035) |
No. of total observations* | 138812 (13693) | 92555 (11899) | 627108 | 65197 (9467) | 232818 (33806) | 63995 (9300) | 104169 (15054) |
Completeness* (%) | 99.2 (97.4) | 96.4 (93.3) | 99.9 (100.0) | 99.8 (99.9) | 99.9 (100.0) | 99.9 (100.0) | 97.7 (96.6) |
Multiplicity* | 5.3 (3.7) | 6.3 (5.8) | 8.1 (8.2) | 3.5 (3.6) | 3.8 (3.8) | 6.7 (6.8) | 4.9 (5.0) |
R merge* (%) | 9.3 (64.0) | 9.2 (40.9) | 7.8 (93.1) | 8.4 (48.4) | 8.2 (50.3) | 13.8 (43.5) | 11.5 (37.6) |
<I/s(I)>a | 16.1 (1.9) | 17.7 (3.5) | 29.3 (2.5) | 12.0 (2.4) | 12.0 (2.5) | 13.4 (3.0) | 15.8 (3.6) |
Refinement |
|
|
|
|
|
|
|
R factor (%) | 18.8 | 20.6 | 25.9 | 22.4 | 18.5 | 22.4 | 21.4 |
R free (%) | 23.9 | 25.9 | 30.2 | 29.1 | 24.8 | 28.6 | 27.3 |
Rmsd bond length (Å) (angle (°)) | 0.019 (1.6) | 0.015 (1.4) | 0.011 (1.2) | 0.014(1.4) | 0.017 (1.5) | 0.016(1.6) | 0.011 (1.2) |
PDB ID | 2BR9 | 2BTP | 2B05 | 2C74 | 2C63 | 2C23 | 2BQ0 |
* Numbers in parentheses refer to the highest resolution shell.
Table 3. Showing which structures of 14-3-3 isoforms have utilized the S1b and S2 patches in crystal packing. These patches are proposed to mediate protein-protein contacts
14-3-3 | PDB ID | Space group | S1b | S2 |
β | 2BQ0 | P 21 | YES | YES |
β | 2C23 | C 2221 | NO | YES |
ε | 2BR9 | C 2221 | YES | YES |
γ | 2B05 | P 41212 | NO | YES |
η | 2C63 | P 21 | NO | YES |
η | 2C74 | P 212121 | NO | YES |
τ | 2BTP | P 21 | NO | YES |
σ | 1YWT | C 2221 | NO | YES |
ζ | 2C1N | P 21 | NO | YES |
ζ | 1QJA | P 212121 | NO | YES |
ζ | 1A38 | P 65 | NO | NO |
Table 4. Constructs used for structure determination
14-3-3 | Residue range | Expression vector | Tag | Tag sequence | Tag cleaved before crystallisation? |
β | 1-239 | pTvHR21-SGC | C-terminal | ...ENLYFQSLEHHHHHH | Yes |
ε | 1-233 | pLIC-SGC | N-terminal | MHHHHHHSSGVDLGTENLYFQS... | Yes |
γ | 1-247 | pTvHR21-SGC | C-terminal | ...ENLYFQSLEHHHHHH | Yes |
η | 1-246 | pNIC28-Bsa4 | N-terminal | MHHHHHHSSGVDLGTENLYFQS... | Yes |
τ | 1-234 | pNIC28-Bsa4 | N-terminal | MHHHHHHSSGVDLGTENLYFQS... | No |