Blood, Vol. 109, Issue 12, 5230-5233, June 15, 2007
Friend of GATA-1–independent transcriptional repression: a novel mode of GATA-1 function
Blood Johnson et al. 109: 5230
Supplemental materials for: Johnson et al, Vol 109, Issue 12, 5230-5233
Files in this Data Supplement:
- Document 1. Supplemental materials and methods (PDF, 34.5 KB)
- Figure S1. Microarray analysis of repression by ER-GATA-1(V205G) (JPG, 273 KB) -
RNA was isolated from untreated or -estradiol treated (1 µM, 24 hours) G1E cells expressing ER-GATA-1(V205G). RNA samples from three independent experiments were pooled and used to hybridize to the Affymetrix GeneChip Mouse Genome 430 2.0 Array. Known genes that are repressed on the array are listed in order of decreasing signal log ratio (to a score of −1.4). For comparison, the array scores of FOG-1–dependent genes are presented at the bottom of the list. From left to right; Probe Set, Signal Values (0 hour to 24 hours), Signal Log Ratio, Gene Symbol, and Gene Name. The array was conducted as a discovery tool and was not designed to comprehensively identify all differentially expressed genes. The full array dataset has been deposited in NCBIs Gene Expression Omnibus (GEO, http://www.ncbi.nlm.nih.gov/geo/) and are accessible through GEO Series accession number GSE6958.
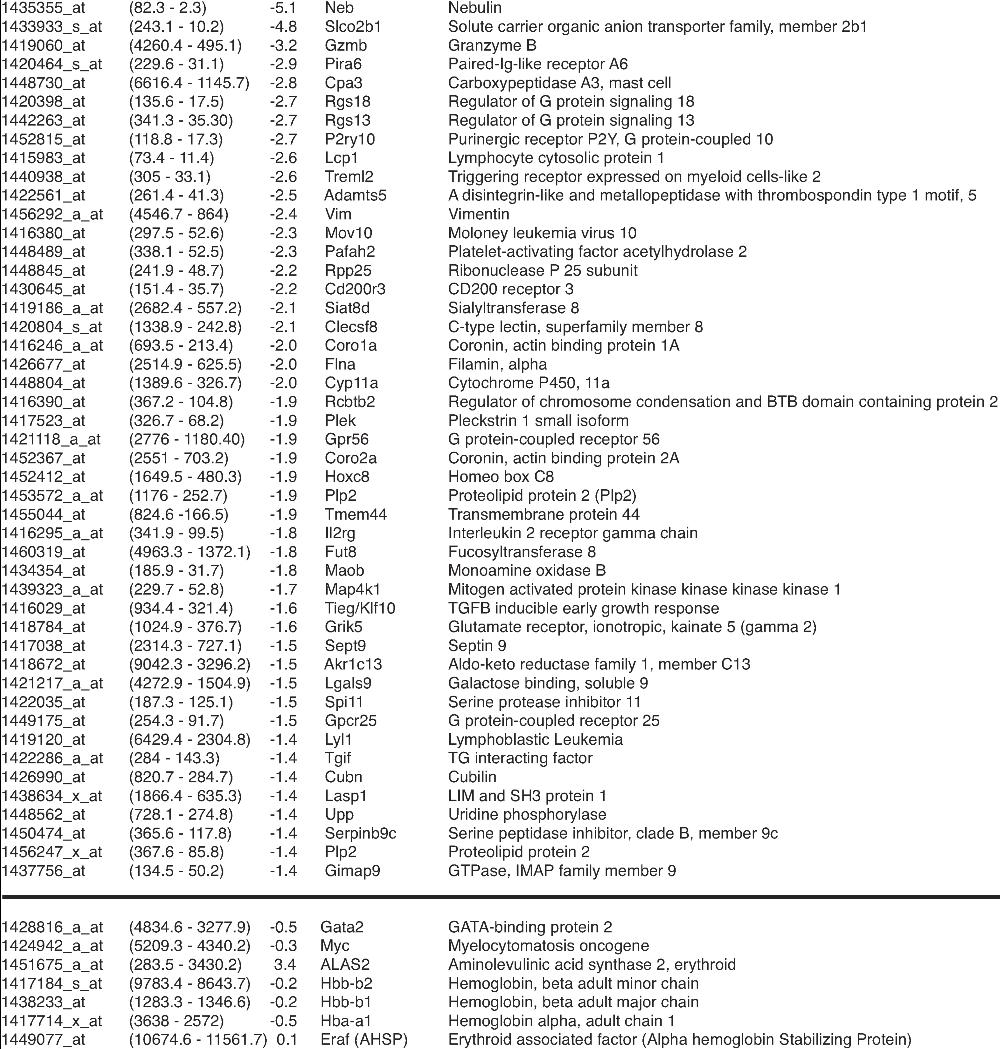
- Figure S2. β-estradiol does not regulate new GATA-1 target genes in G1E cells lacking ER-GATA-1 (JPG, 71.4 KB) -
Transcript levels were compared in untreated and-estradiol treated (1 µM, 24 hours) G1E cells by real time RT-PCR. Transcript levels were normalized to GAPDH transcript levels and, for each clone, the mean value for untreated cells was set to 1 (mean ± SE from three independent experiments).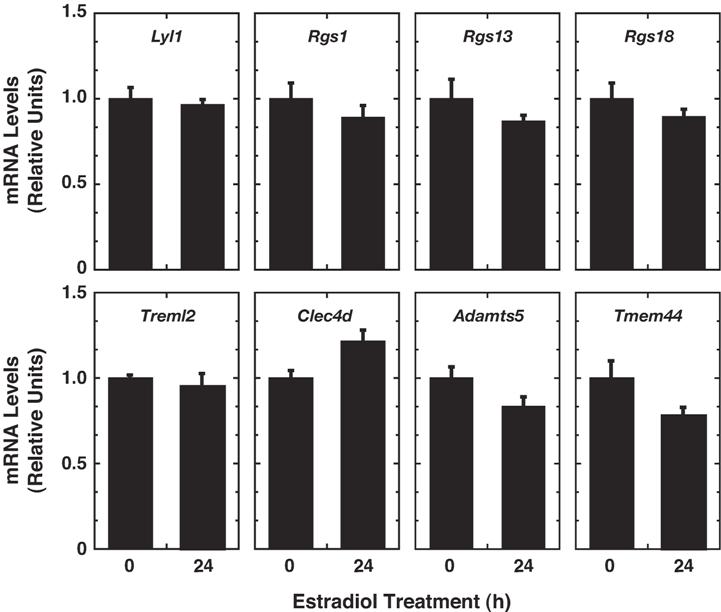
- Figure S3. GATA factor occupancy of Lyl1 in mouse embryonic stem cell-derived embryoid bodies (JPG, 43.4 KB) -
Murine embryoid bodies were differentiated for four days by standard methodology.1 GATA-2 and GATA-1 occupancy at sites within Lyl1 in day 4 EBs was determined by ChIP analysis from two independent experiments (Mean ± SD). PI indicates preimmune sera.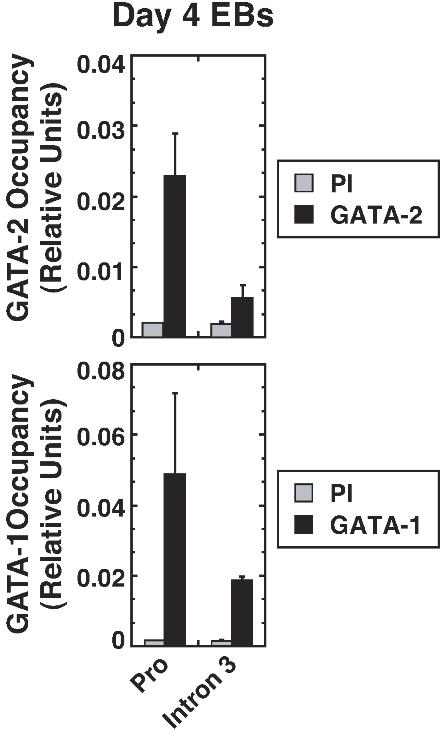
1. Choi K, Kennedy M, Kazarov A, Papadimitriou JC, Keller G. A common precursor for hematopoietic and endothelial cells. Development. 1998;125:725-732.