Abbani et al. 10.1073/pnas.0607820104. |

Fig. 6. Sequence of the phage l attR region from -50 to -121 with the Int P2, Xis X1, X1.5, and X2, and Fis core F-binding sites delineated above. Numbering is relative to the center of the crossover region. Shown below is the duplex sequence used for crystal growth and the top strand of the oligonucleotide substrates used in the binding studies.

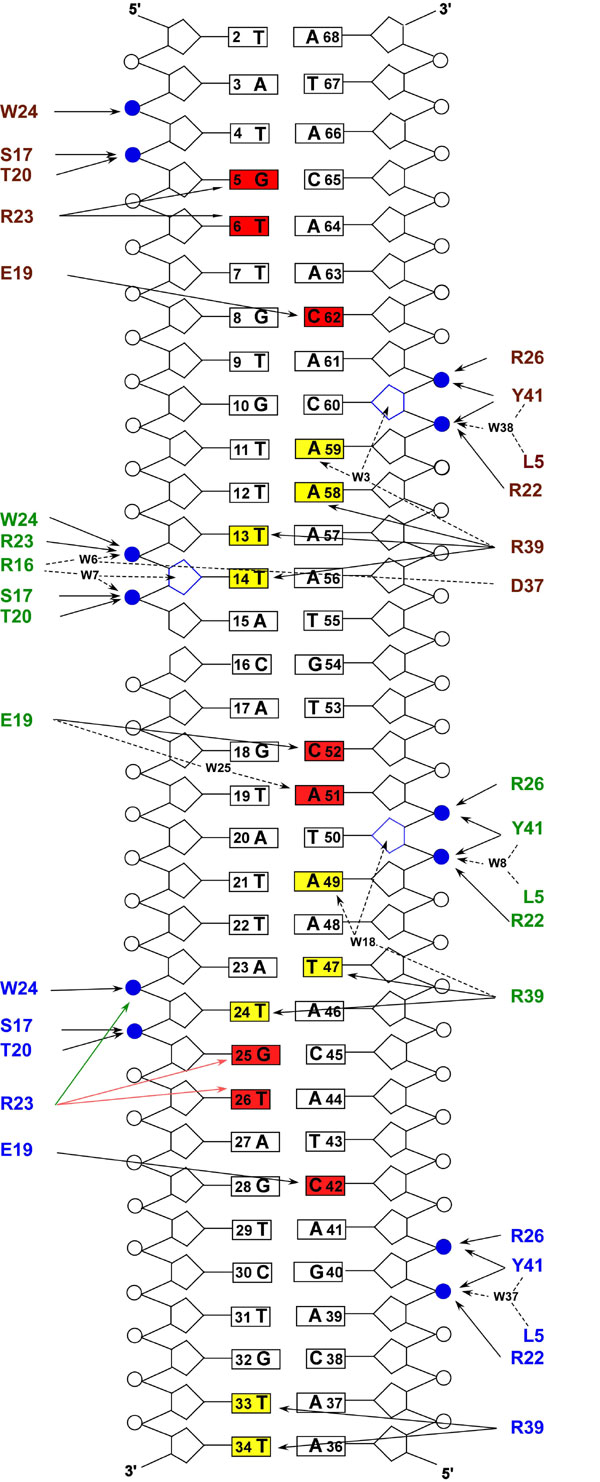
Fig. 7. Schematic showing protein-DNA interactions in the Xis-DNAX1-2 complex. The residues are color coded as in Fig. 3A. Direct and water-mediated hydrogen bonds are indicated with continuous-line and broken-line arrows, respectively. Specific direct and indirect protein contacts made to the bases of the duplex in the major and minor grooves are shaded in red and yellow, respectively. The two contact states of residue R23 from monomer A are indicated by green and red arrows. Additional contacts made to the sugar-phosphate backbones are colored in blue. Solvent molecules are designated by W.

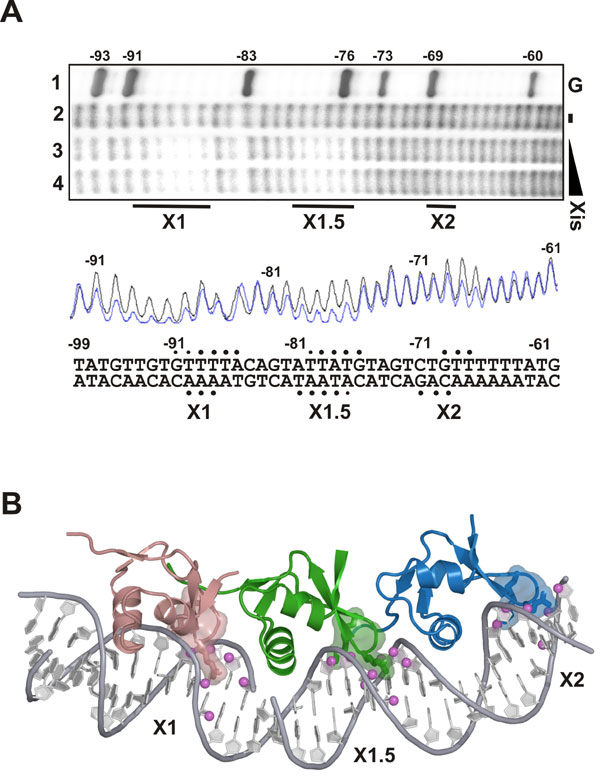
Fig. 8. To confirm that the position of the Xis protomers in the crystal accurately reflects the cooperatively-bound complex in solution, hydroxyl radical footprinting experiments were performed. (A) Xis binding to the attR fragment protects three DNA regions from hydroxyl radical cleavage: strong protection is observed between -91 to -86, which corresponds to the X1 site; strong protection is observed between -80 to -76, which corresponds to X1.5; and somewhat weaker protection is observed between -69 and -67, which corresponds to X2. Lane 1, G sequencing reaction (1); lane 2, no Xis protein; lanes 3 and 4, 0.5 and 1.6 mM of WT Xis, respectively. Reactions were performed on an attR fragment (-160 to + 43) 5'-32P-labeled on the top strand. Bars below the gel denote protections. Phosphorimager scans are of lanes 2 (no Xis, black line) and 4 (+ Xis, blue line). Solid circles denote hydroxyl radical protections on each DNA strand; smaller circles represent weaker protections. (B) An illustration of how these data are compatible with the crystal structure by displaying the protected cleavage points as spheres on the DNA within the minor groove. All of the protected sites correspond to the regions contacted by each of the wing motifs in the crystal structure. Strong hydroxyl radical protections are denoted by magenta balls at the C4' positions. The side chains of Xis residues Lys-36, Gly-38, and Arg-39 are shown in each Xis monomer as sticks and rendered as transparent surfaces.
1. Maxam AM, Gilbert W (1980) Methods Enzymol. 65:499-560.

Fig. 9. Stereoimage of the experimental electron density map after solvent flattening. The map shows a portion of the protein-DNA interface of the Xis-DNAX1-X2 complex contoured at 1.2 s.
Table 1. Data collection and refinement statistics
Native | Br | ||
Peak | Remote | ||
Data collection | |||
Space group | P3121 | P3121 | P3121 |
Beamline/generator | ALS 8.2.2 | ALS 8.2.2 | ALS 8.2.2 |
Resolution, Å | 90.0-2.6 | 90.0-3.0 | 90.0-3.0 |
Wavelength, Å | 0.9537 | 0.9197 | 0.9116 |
Total reflections | 119121 | 160829 | 243270 |
Unique reflections | 17185 | 19752 | 21803 |
Redundancy | 6.9 | 8.1 | 11.2 |
Completeness, % | 99.9 (100.0) | 91.2 (92.6) | 100.0 (100.0) |
R merge, % | 8.3 (64.4) | 9.1 (33.5) | 10.9 (59.1) |
I/σ (I) | 24.0 (3.0) | 19.8 (5.6) | 22.4 (4.7) |
Refinement statistics | |||
Resolution, Å | 2.6 | ||
R cryst, % | 19.9 | ||
R free, % | 24.6 | ||
rmsds | |||
Bonds, Å | 0.019 | ||
Angles, º | 0.65 | ||
Numbers in parentheses represent data in the highest-resolution shell (3.00 to 3.11 Å for the bromo-DNA derivative and 2.60 to 2.69 Å for the native). Rmerge(I) = ∑hkl((∑i|Ihkl,i − [Ihkl]|)/∑iIhkl,i). Rcryst = ∑hkl¦Fobs| − |Fcalc¦/∑hkl|Fobs||, where Fobs and Fcalc are the observed and calculated structure factors, respectively. Rfree is a test set of 5% reflections that were not used during refinement. Br indicates the data set with 5-bromouracil substitutions colored red in Fig. 1B used for phasing by the method RIPAS(1).
1. Zwart PH, Banumathi S, Dauter M, Dauter Z (2004) Acta Crystallogr D 60:1958-1963.
SI Text
Crystallization of the Complex
The DNA binding domain of Xis (residues 1-55 with a Cys-to-Ser mutation at position 28) was purified as described (1). A 33-bp DNA duplex corresponding to the Xis binding region with single nucleotide overhangs on each 5' end (5'-TATGTTGTTTTACAGTATTATGTAGTCTGTT/ 5'-TAACAGACTACATAATACTGTAAAACACAACATA, X1 and X2 bases are underlined) was used to form crystals of the Xis-DNAX1- 2 complex. A ~ 2.0:1.2 Xis-DNAX1- 2 complex was formed under physiological salt conditions [200 mM NaCl and 25 mM NaOAc (pH 5.5)] at a concentration of 100 mM. The complex was then buffer exchanged to remove NaCl by dialysis and subsequently concentrated to »12 mg/ml [using a microcon-YM3 (Millipore)]. Reproducible crystals of the complex that diffracted to 10-Å resolution were grown in 30% PEG 4K, 0.2 M NH4OAc, and 0.1 M NaCitrate pH 6.2, and 10 mg/ml of the Xis-DNAX1- 2 complex using the hanging drop method and further dehydrated to dramatically improve the crystal quality (2-4). The Xis-DNAX1- 2 cocrystals were dehydrated by replacing the well solution with mother liquor containing additional PEG 4K precipitant (dehydrating solution: 35-40% PEG 4K, 0.2 M NH4OAc, and 0.1 M NaCitrate, pH 6.2). The solution in the hanging-drop was also manually exchanged to increase its precipitant concentration. This was accomplished by adding 3 ml of the dehydrating solution to the 2-ml drop containing the crystal. The drop solution was then mixed and 3 ml was removed. The crystals were allowed to dehydrate in the increased precipitant solution for 16 h. Dehydration at 4°C significantly improved the diffraction from 10 to ~2.6 Å. A complete description of the crystallization and dehydration of the complex has been published (5). Similar approaches were used to crystallize the complex between Xis and a derivatized DNA that contained 5-bromo-uracil substituted at four thymine bases (Fig. 1B and SI Table 1).
Data Collection, Processing, Model Building, and Refinement
Crystals were flash-frozen in liquid nitrogen at -195°C. Cryogenic x-ray diffraction data of both native and brominated complexes were collected at Beamline 8.2.2 at the Advanced Light Source (Lawrence Berkeley National Laboratory, Berkeley, CA). The oscillation angle was set to 1° and the exposure time was 5 and 3 s per frame for the native and brominated complexes, respectively. The data sets were integrated with the program DENZO (6), and the intensities were merged and scaled with the program SCALEPACK (6). The Xis-DNAX1-2 crystals belong to space group P3121, with unit cell dimensions for the native data set a = b = 111.7 Å, c = 76.3 Å, a = b = 90o and g = 120o (SI Table 1). The asymmetric unit contains three Xis protomers plus one DNA molecule; the crystal contained »67% solvent. A three-wavelength MAD experiment was attempted and peak, inflection, and high remote data sets were collected. However, exposure to the x-ray beam caused radiation-induced damage to crystals, resulting in debromination of bromouridines during irradiation (7). In particular, the peak data contained effects caused by brominated DNA, while analysis of subsequent inflection and high remote data sets indicated that the crystal had become debrominated. Because no significant anomalous signal was observed for the high remote, the structure of the complex was solved by a variation of the single isomorphous replacement with anomalous scattering (SIRAS) method called radiation-damage-induced phasing with anomalous scattering (RIPAS) (8). In this approach, the high remote data are used as a pseudo native data set (whereas the "true" native data are one without the bromine substitutions in the DNA). The four bromine sites for the derivative were located from anomalous difference Patterson maps and confirmed with the SHELXD (9) and XTALVIEW (10) suite of programs. The heavy atoms parameters were refined and phase information was generated with SHELXE (9). The experimental phases were further improved by solvent flattening with CCP4-DM (11) and used to calculate the initial experimental electron-density map.
A portion of the complex was built to fit the electron density by using the previously solved single Xis-DNA x-ray structure (a 1:1 complex between Xis and a 14-bp DNA duplex containing site X2) (12). The remainder of the model was built into the experimental electron-density map by using the program O (13) and refined by using CCP4-REFMAC (14). A representative portion of the experimental electron density map after solvent flattening is shown in SI Fig. 9. The parameters of the multiple copies of the proteins were refined with NCS restraints, which were removed toward the end of the refinement. The final model was refined against a native data set to 2.6 Å with a crystallographic Rwork of 19.9% for 16,295 reflections and Rfree of 24.6% of 863 reflections between 55.8- and 2.6-Å resolution. Protein geometry was evaluated with ERRAT (15), WHATIF (16), and PROCHECK (17). A total of 93.5% and 6.5% of all j, y backbone torsion angles lie within the most favorable and favored regions of the Ramachandran plot, respectively. Complete refinement statistics are listed in SI Table 1. DNA parameters were evaluated with the programs CURVES (18) and 3DNA (19). The structure figures were prepared by using the program PYMOL (20).
Hydroxyl Radical Footprinting
Hydroxyl radical footprinting was performed essentially as described by Dixon et al. (21) on attR fragments (-160 to + 43) labeled with 32P at the 5' ends of the top or bottom strands. Standard Xis binding reactions were performed except that the volume was 25 ml and glycerol was absent from both the binding and protein dilution buffers. Reactions were incubated with 3 mM sodium ascorbate, 0.09% hydrogen peroxide, and 0.3 mM Fe-EDTA for 3 min at room temperature and quenched with 26 mM thiourea. The scans were generated by using ImageQuant software (Amersham Pharmacia).
1. Sam MD, Papagiannis C, Connolly KM, Corselli L, Iwahara J, Lee J, Phillips M, Wojciak JM, Johnson RC, Clubb RT (2002) J Mol Biol 324:791-805.
2. Haebel PW, Wichman S, Goldstone D, Metcalf P (2001) J Struct Biol 136:162-166.
3. Kuo A, Bowler MW, Zimmer J, Antcliff JF, Doyle DA (2003) J Struct Biol 141:97-102.
4. Tong L, Qian C, Davidson W, Massariol MJ, Bonneau PR, Cordingley MG, Lagace L (1997) Acta Crystallogr D 53:682-690.
5. Sam MD, Abbani MA, Cascio D, Johnson RC, Clubb RT (2006) Acta Crystallogrt F 62:825-828.
6. Otwinowski Z, Minor W (1997) Methods Enzymol 276:307-326.
7. Ennifar E, Carpentier P, Ferrer JL, Walter P, Dumas P (2002) Acta Crystallogr D 58:1262-1268.
8. Zwart PH, Banumathi S, Dauter M, Dauter Z (2004) Acta Crystallogr D 60:1958-1963.
9. Schneider TR, Sheldrick GM (2002) Acta Crystallogr D 58:1172-1779.
10. McRee DE (1999) J Struct Biol 125:156-165.
11. Cowtan K (1994) Joint CCP4 ESF-EACBM Newsl Protein Crystallogr 31:34-38.
12. Sam MD, Cascio D, Johnson RC, Clubb RT (2004) J Mol Biol 338:229-240.
13. Jones TA, Zou JY, Cowan SW, Kjeldgaard M (1991) Acta Crystallogr A 47:110-119.
14. Murshudov G, Vagin A, Dodson E (1997) Acta Crystallogr D 53:240-255.
15. Colovos C, Yeates TO (1993) Protein Sci 2:1511-1519.
16. Vriend G (1990) J Mol Graphics 8:52-56.
17. Laskowski RA, Rullmannn JA, MacArthur MW, Kaptein R, Thornton JM (1996) J Biomol NMR 8:477-486.
18. Lavery R, Sklenar H (1988) J Biomol Struct Dyn 6:63-91.
19. Lu XJ, Olson WK (2003) Nucleic Acids Res 31:5108-5121.
20. DeLano WL (2002) PYMOL (DeLano Scientific, San Carlos, CA).
21. Dixon WJ, Hayes JJ, Levin JR, Weidner MF, Dombroski BA, Tullius TD (1991) Methods Enzymol 208:380-413.