Blood, Vol. 110, Issue 7, 2620-2630, October 1, 2007
Epstein Barr virus–specific cytotoxic T lymphocytes expressing the anti-CD30 artificial chimeric T-cell receptor for immunotherapy of Hodgkin disease
Blood Savoldo et al. 110: 2620
Supplemental materials for: Savoldo et al
Files in this Data Supplement:
- Figure S1. Cytotoxic activity of CD30CAR+ CTLs (JPG, 51.5 KB) -
Figure S1A and S1B show the cytotoxic activity of control and CD30CAR+ EBV-CTLs, respectively, from a representative healthy donor. Figure S1C and S1D show the cytotoxic activity of control and CD30CAR+ EBV-CTLs, respectively, generated from a representative HD patient. The graphs illustrate the percent specific lysis of the CTLs against: autologous LCL lines (filled diamond), HLA-mismatched LCLs (filled square), the two CD30+ cell lines HDLM-2 (open triangle) and Karpas-299 (asterisk), a CD30-negative target cell line (open circle), and autologous PHA blasts (filled circle). Shown are data with more detailed titration (from 40:1 to 5:1 Effector:Target ratios).
- Figure S2. Cytotoxic activity of CD30CAR+ CTLs against PHA blasts (JPG, 68.6 KB) -
Figure S2A shows CD30 expression, evaluated by FACS, on PHA blasts on day 4 and day 8 of culture and of genetically modified blasts stably expressing CD30 (as described in the Material and Method section) for one representative of 3 donors. These cells were then labelled with 51Cr and used as targets in a standard cytotoxicity assay. Figure S2B shows the percent specific lysis of CD30CAR+ CTLs against these targets. Killing of cells that highly expressed CD30 occurs, while CD30 negative/low cells are not lysed.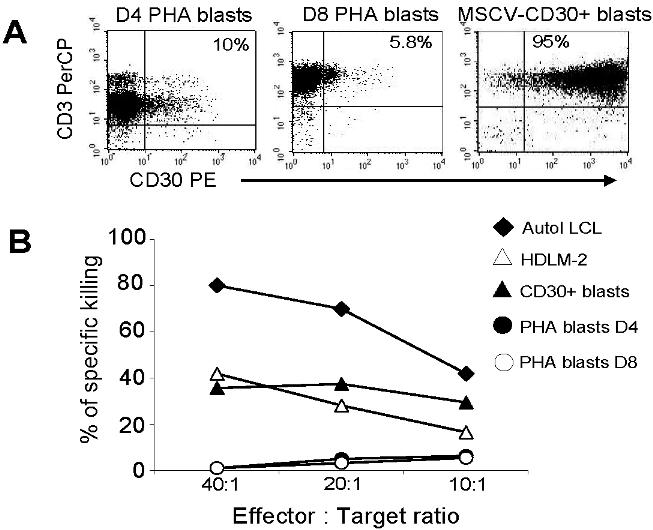
- Figure S3. Killing of CD30 overexpressing T cells by CD30CAR (JPG, 61 KB) -
Figure S3A shows the expression of the CD30 molecule on PHA blasts, T blasts transduced with a retroviral vector to stably express the CD30 antigen and HDLM-2, a HD cell line constitutively expressing the CD30 antigen. Figure S3B shows the percent of specific killing by control and CD30CAR+ CTLs against these targets as assessed in a standard 51Cr release assay. Shown is the 20:1 Effector:Target ratio. CD30 overexpressing blasts are lysed at a comparable level as HDLM-2.
- Figure S4. Evaluation of bioluminescent signal and expansion of T cells (JPG, 51.8 KB) -
Mice with differing bioluminescence signals at the tumor site were euthanized, and the cells isolated and stained with anti-human CD3 and CD45 MAbs. Figure S4A shows that mice with higher bioluminescence intensity (3 × 10⁷ p/s/cm2/sr) also had higher numbers of CD3+ T cells (∼40%). Intermediate intensity is shown in Figure S4B (5 × 10⁶ p/s/cm2/sr). The number of T cells in this case was lower (∼20% of CD3+ T cells). Figure S4C shows a mouse with no measurable bioluminescence (1 × 10⁵) and correspondingly negligible CD3+ T cells (