Jones et al. 10.1073/pnas.0705971104. |
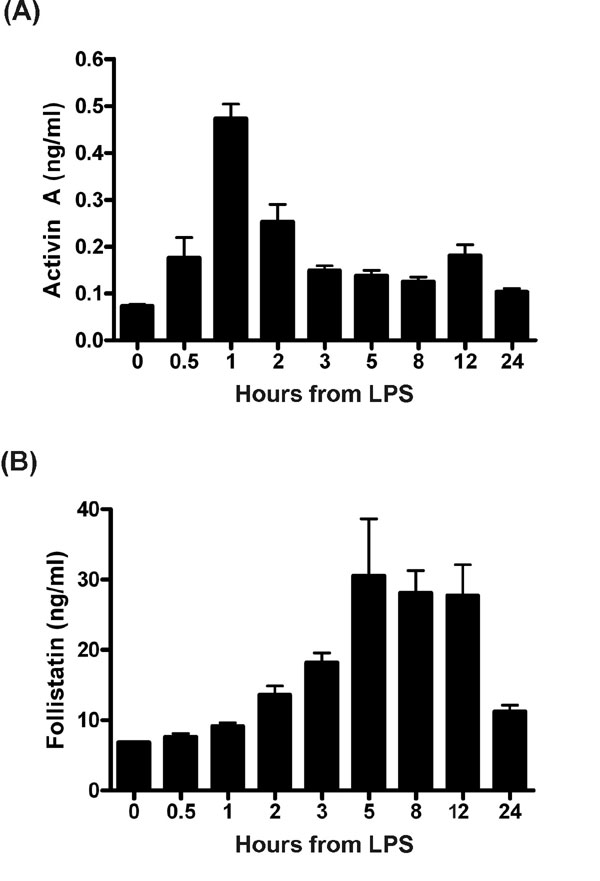
Fig. 6. Detection of activin A in mouse plasma from mice injected with a commercial preparation of LPS. (A) Plasma was collected from 4- to 8-week-old C57BL/6 (n = 6/group) mice that received a 100-mg i.p. injection of LPS. This plasma was assayed for activin A to identify whether activin was released in mice after LPS administration. Activin A in plasma increased rapidly and robustly. (B) Plasma levels of follistatin in mice injected with LPS. Follistatin increased gradually from 2 h, peaked at 5 h, and returned to basal levels at 24 h relative to LPS. All data are mean ±SE.
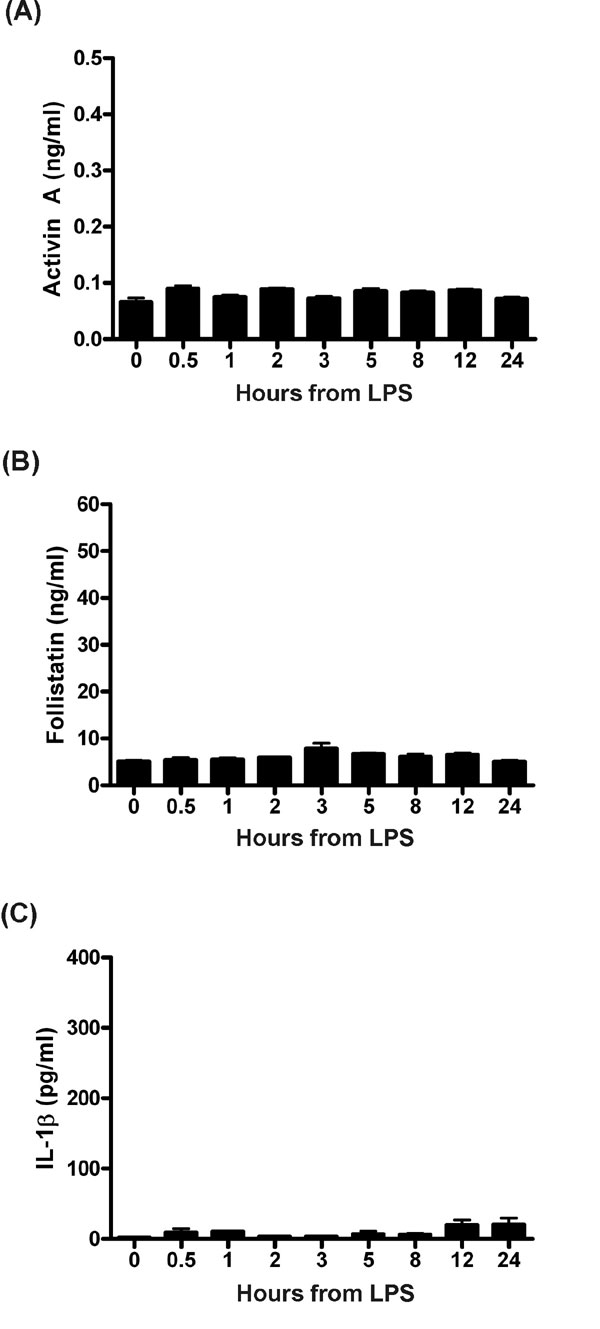
Fig. 7. Response in C3H/HeJ mice. Reduced cytokine response in mice with a mutation in TLR4 challenged with LPS. C3H/HeJ mice (n = 6/group) were administered a 100-mg i.p. injection of of phenol-purified LPS. (A) Activin A did not alter significantly from basal levels. (B) Follistatin showed a minor and transient increase. The TNF and IL-6 response was ~1% of normal levels in these mice (data not shown). (C) The IL-1b response to LPS was ~10% of the normal response to LPS. All data are mean ± SE. Note the y-axis scale represents that used for profiles exhibited in Fig. 1 with C57BL/6 mice.
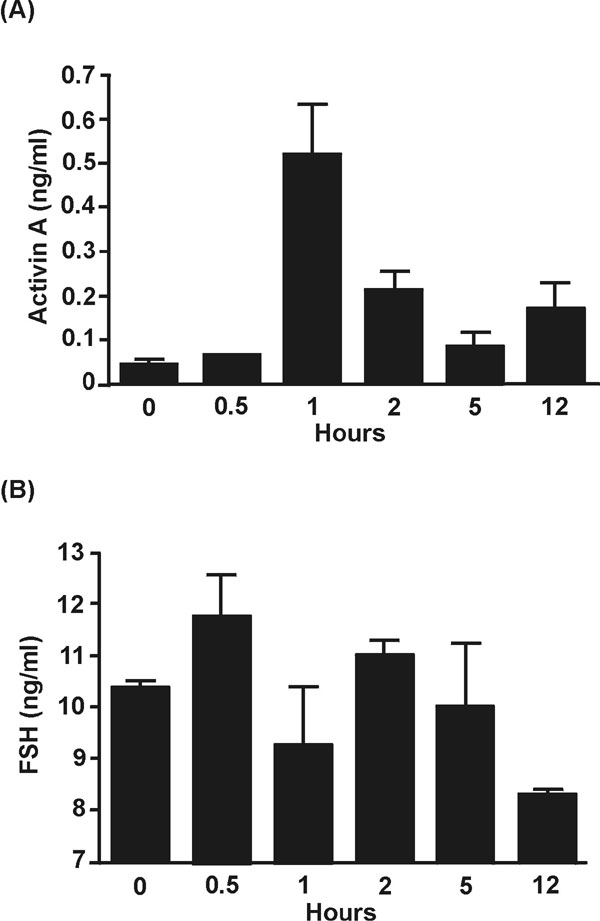
Fig. 8. Confirmation of the blockade of activin effects occurred in response to administration of recombinant human follistatin. (A) Activin A concentrations in the circulation of 4- to 8-week-old C57BL/6 (n = 2/group) mice injected with 1 mg human recombinant follistatin 288, 30 min before LPS challenge. Activin A peaked 1 h after the injection of LPS, and these levels are sufficient to modulate FSH release from the pituitary (1). (B) Follicle-stimulating hormone (FSH) concentrations in these animals, as measured by specific immunoassay, were suppressed at the same time that activin A peaked (A), as expected if follistatin were suppressing and neutralizing the effects of activin.
1. Rivier, C, Vale, W (1991) Endocrinology 129: 2463-2465.

Fig. 9. Response of activin subunit mRNAs to systemic LPS challenge. (A) Mean ± SE mRNA levels measured by real-time PCR of the activin bA-subunit in liver after systemic LPS administration. The profiles are relative to the injection of LPS, with mRNA levels given as fold changes relative to the mRNA levels in untreated animals. Note that levels undergo a small and transient increase 1 h after LPS and then undergo a profound decrease for a number of hours. (B) Levels of activin bA-subunit mRNA in liver, spleen, and testis after LPS administration. Although there are tissue-specific changes in expression level, these do not account for the rapid and profound release of activin A protein. Time points are at LPS administration and at 1 and 3 h post-LPS. Data are mean ± SE. (C) Fold increases in hepatic activin bB-subunit mRNA after systemic administration of LPS. The profiles are relative to the injection of LPS, with mRNA levels given as fold changes relative to the mRNA levels in untreated animals. Data are mean ±SD.
SI Methods
FSH RIA.
Concentrations of FSH in mouse serum were determined by RIA using reagents kindly provided by A. Parlow (National Institute of Diabetes and Digestive and Kidney Diseases, Bethesda, MD). The iodination preparation and antiserum used were rFSH I-8 and anti-rFSH-S-11, respectively. Samples were assayed in 20-ml duplicates. Results are expressed in terms of National Institute of Diabetes and Digestive and Kidney Diseases mFSH-RP-1. The tracer was iodinated by using Iodogen reagent (Sigma-Aldrich, St Louis, MO). Goat anti-rabbit IgG (GAR#12; Monash Institute of Medical Research, Monash University, Melbourne, Australia) was used as a second antibody. The lowest limit of detection was 1.43 ng/ml, the average within-assay CV was 6.0%, and the interassay CV was 7.1% calculated by using a pool of normal mouse serum used in each assay.Real-Time PCR Measurements.
Tissues to be examined for expression levels were placed in ice-cold Trizol (Invitrogen, Carlsbad, CA) and stored at -80 C for later RNA extraction. Extractions were performed on three to five tissue samples from each time point. RNA was extracted by using Trizol according to the manufacturer's recommendations. For each sample, »10 mg of RNA was treated with DNase I (Ambion, Austin, TX). RNA concentrations for each sample were determined, and 1 mg was reverse transcribed to give cDNA using a Superscript III reverse transcriptase (Invitrogen).Real-time analysis for expression levels were performed for GAPDH, the activin bA-subunit and the activin bB-subunit. Primers were designed specifically for use with the Roche Light Cycler real-time PCR system. These were for GAPDH, Sense tactggcatcttcaccacca and Antisense gtgagcttcccattcagctc [394 base pairs (bp) product length]; activin bA-subunit, Sense ggctaacagaaccaggacca and Antisense cttcttcccatctccatcca (325 bp product); and activin bB-subunit, Sense gacacgcatagccagactca and Antisense acttgccctctccaagaaca (399 bp product). PCR products were sequenced, and BLAST analysis was used to confirm they represented the desired gene products. Real-time analyses were conducted by using a Roche real-time PCR machine using SYBR green (Light cycler Fast start DNA Master SYBR green; Roche Diagnostics, Indianapolis, IN), with conditions optimized for maximal sensitivity. Annealing temperatures for all primers were 60°C. Standards and quality controls used throughout the analyses were prepared from pooled cDNA derived from experimental samples in which expression levels of the genes of interest were high. Serial dilutions of the standard cDNA covered a 300-fold expression range. Experimental cDNA samples were diluted into the standard curve range, and all cDNA was aliquoted and stored at -20°C. Each sample was analyzed for all gene products, at least twice, in independent analytical runs. GAPDH was selected as a housekeeping gene on the basis of its expression level stability. Between-assay reproducibility gave CVs of <17%, and within-assay CVs were typically <5%.