[View Larger Version of this Image]
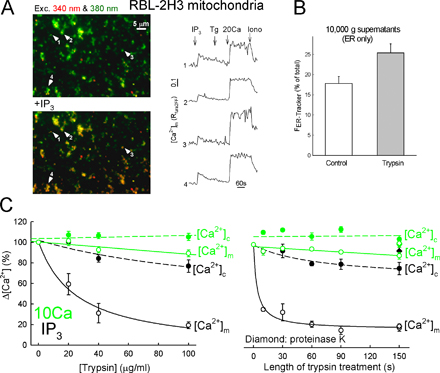
Figure S2. Protein linkage between ER and mitochondria of RBL-2H3 cells. (A) Effect of IP3 on [Ca2+]m in a mitochondrial fraction isolated from fura2FF-loaded RBL-2H3 cells. Adherent particles were sequentially exposed to IP3 (8 µM), Ca2+ (20 µM CaCl2 = 20 Ca) and ionomycin (5 µM). (left) Overlaid fluorescence images recorded at 340 nm (red)/380 nm (green) excitation displaying increased red and decreased green component upon IP3 addition in individual (1 and 3 = 1-2 µm) or conglomerated (2 and 4 = 4-10 µm) globular structures. (right) Time course traces of [Ca2+]m recorded as the fluorescence (340/380 nm) ratio from the structures pointed by the numbered arrowheads (B) Aliquots of the mitochondrial fraction of RBL-2H3 cells in suspension were loaded with the fluorescent ER probe ERTracker (Invitrogen) and treated with trypsin (40 µg/ml; 150 s) in the presence (control) or absence of SBI. After treatment, the mitochondria-rich fraction was repelleted (10,000 g; 10 min) and the fluorescence in the supernatant (corresponding to the unbound tracer and the ER vesicles detached from the heavier membrane particles, presumably mitochondria), as well as in the pellet, was measured. The fluorescence values in the bar chart are normalized to the total ERTracker fluorescence (pellet and supernatant together). Means ± SEM; n = 7. (C) Dose dependence (left) and time course (right) of the effect of trypsin on the [Ca2+]c and [Ca2+]m signal. [Ca2+]c and [Ca2+]m increases evoked by IP3 (black) or by Ca2+ addition (green) were quantified in cells pretreated with varying concentrations of trypsin for 150 s (left) or with 100 µg/ml trypsin for 10 to 150 s (right) and normalized to the response in nontreated cells. The effect of proteinase K (20 µg/ml; 150 s) is also shown (diamonds). Means ± SEM are shown. n = 3.