[View Larger Version of this Image]
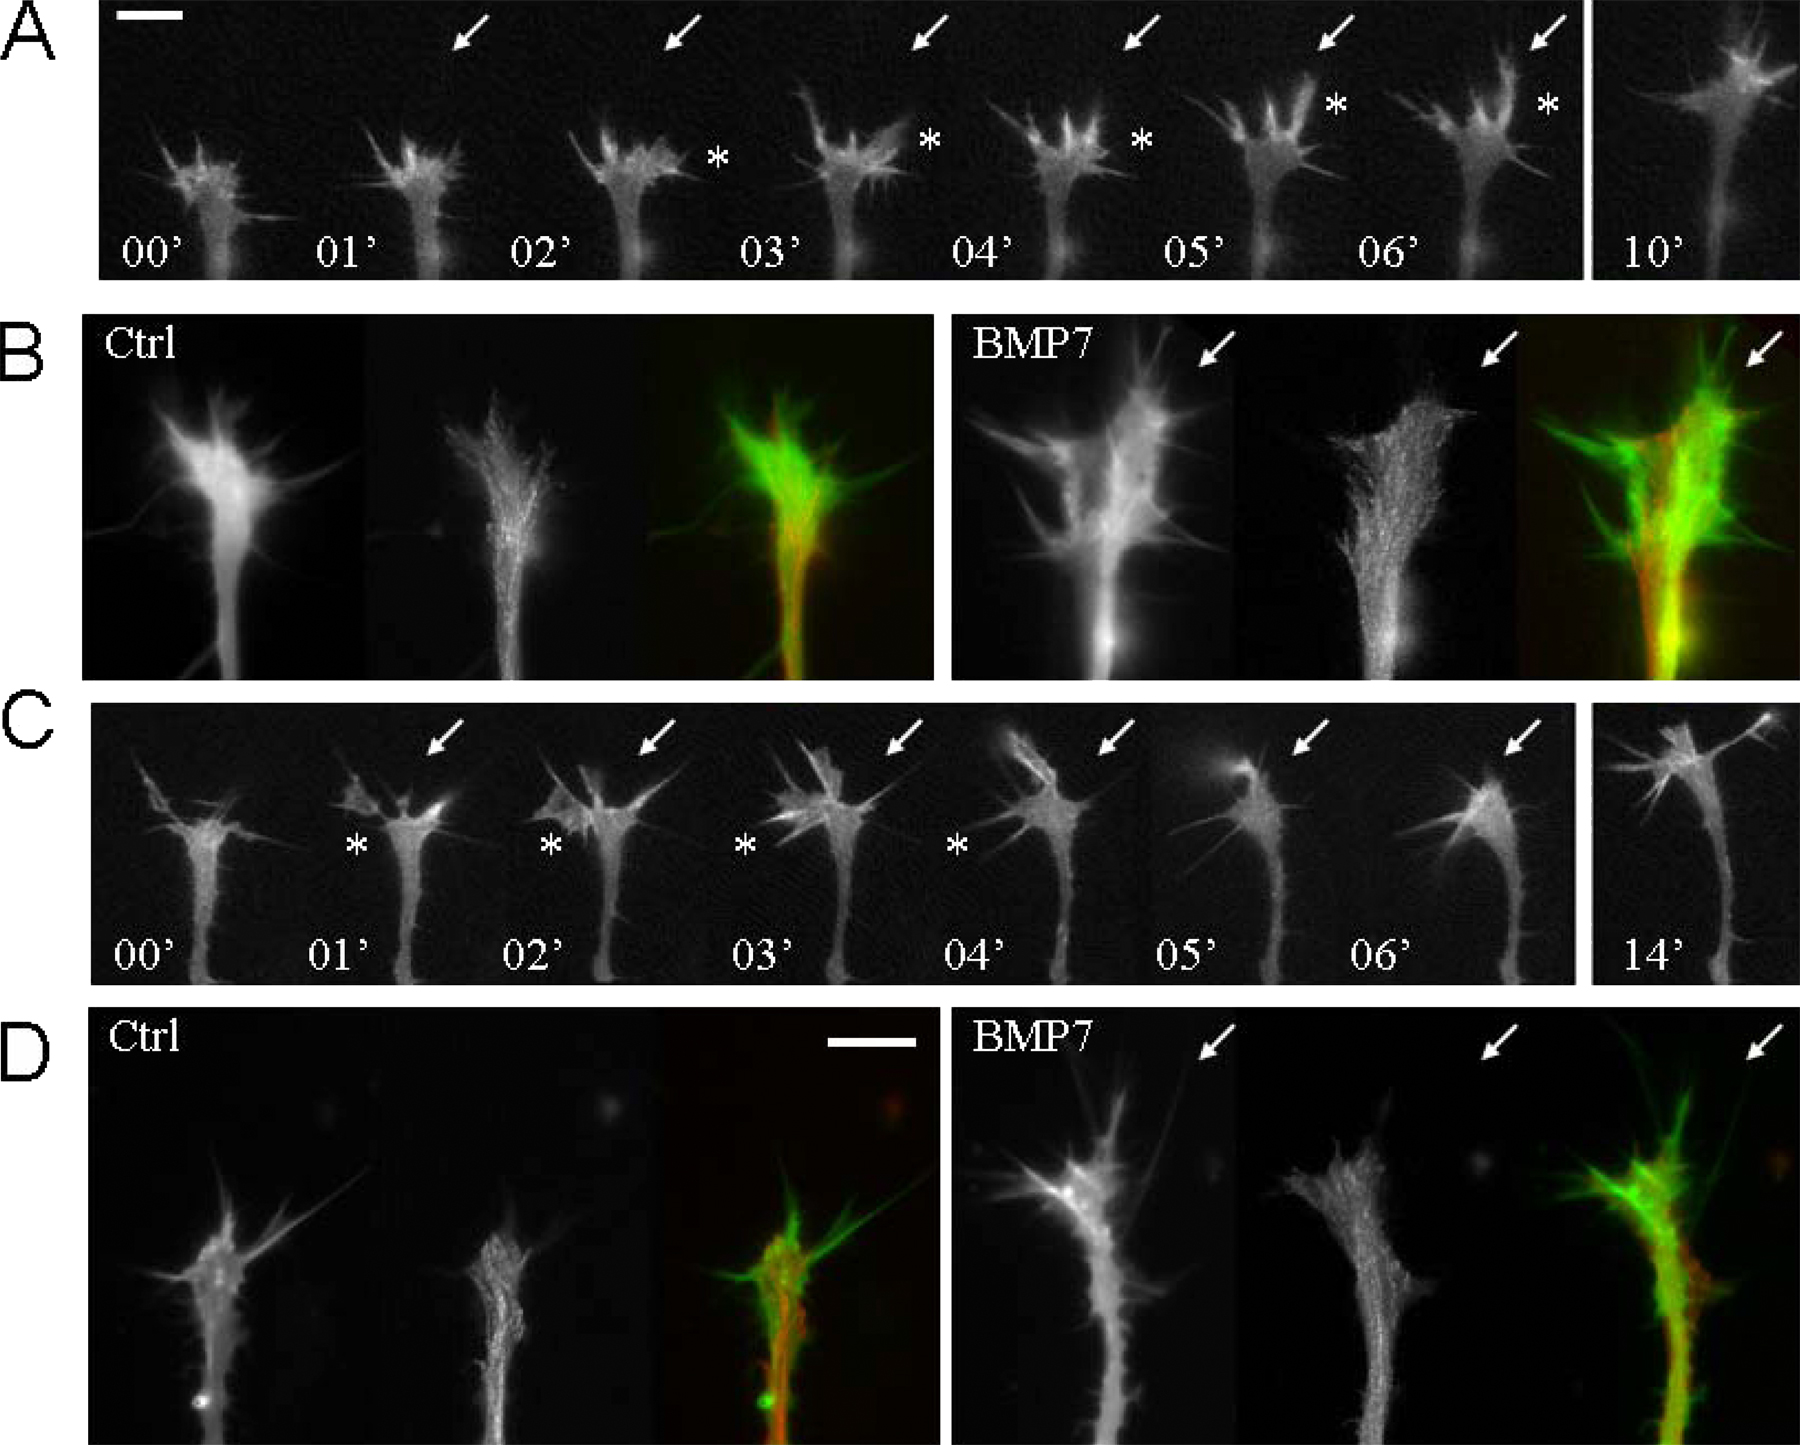
Figure S2. Fluorescence live imaging of GFP-γ-actin and mRFP-EB3 in Xenopus growth cones during attraction and repulsion. (A and B) A Xenopus growth cone from 6-h cultures exhibited attractive turning to the BMP7 gradient. GFP-γ-actin and mRFP-EB3 were imaged simultaneously through the use of DualView (Optical Insights), but only GFP-γ-actin is shown here as a time-lapse sequence (A). The arrows indicate the onset of the BMP7 gradient. Time (in minutes) in the BMP7 gradient is shown. Asterisks mark the local protrusions of lamellipodia and filopodia. To better show the asymmetric distribution, z-projected images of the growth cone from the time-lapse sequences of both GFP-γ-actin and mRFP-EB3 from the control period (left) and the BMP7 application period (right) are shown in B. For each panel, the z-projected GFP-actin (left), mRFP-EB3 (middle), and their color merge (right; green, GFP-γ-actin; red, mRFP-EB3) are presented. Arrows indicate the BMP7 gradient. (C and D) A Xenopus growth cone from the overnight culture was repelled by the BMP7 gradient. The BMP7 gradient inhibited the proximal actin-based protrusive activity but permitted protrusion on the distal side of the growth cone (C; asterisks). At the end of 15 min, the growth cone grew and turned away from the BMP7 gradient (C). To summarize the change in distribution, z-projected images of the growth cone from the time-lapse sequences of both GFP-γ-actin and mRFP-EB3 from the control period (left) and the BMP7 application period (right) are shown in D. For each panel, the z-projected GFP-γ-actin (left), mRFP-EB3 (middle), and their color merge (right; green, GFP-γ-actin; red, mRFP-EB3) are presented. Arrows indicate the BMP7 gradient. Bars, 10 µm. The complete time-lapse sequences of these two growth cones are included as supplemental videos.