[View Larger Version of this Image]
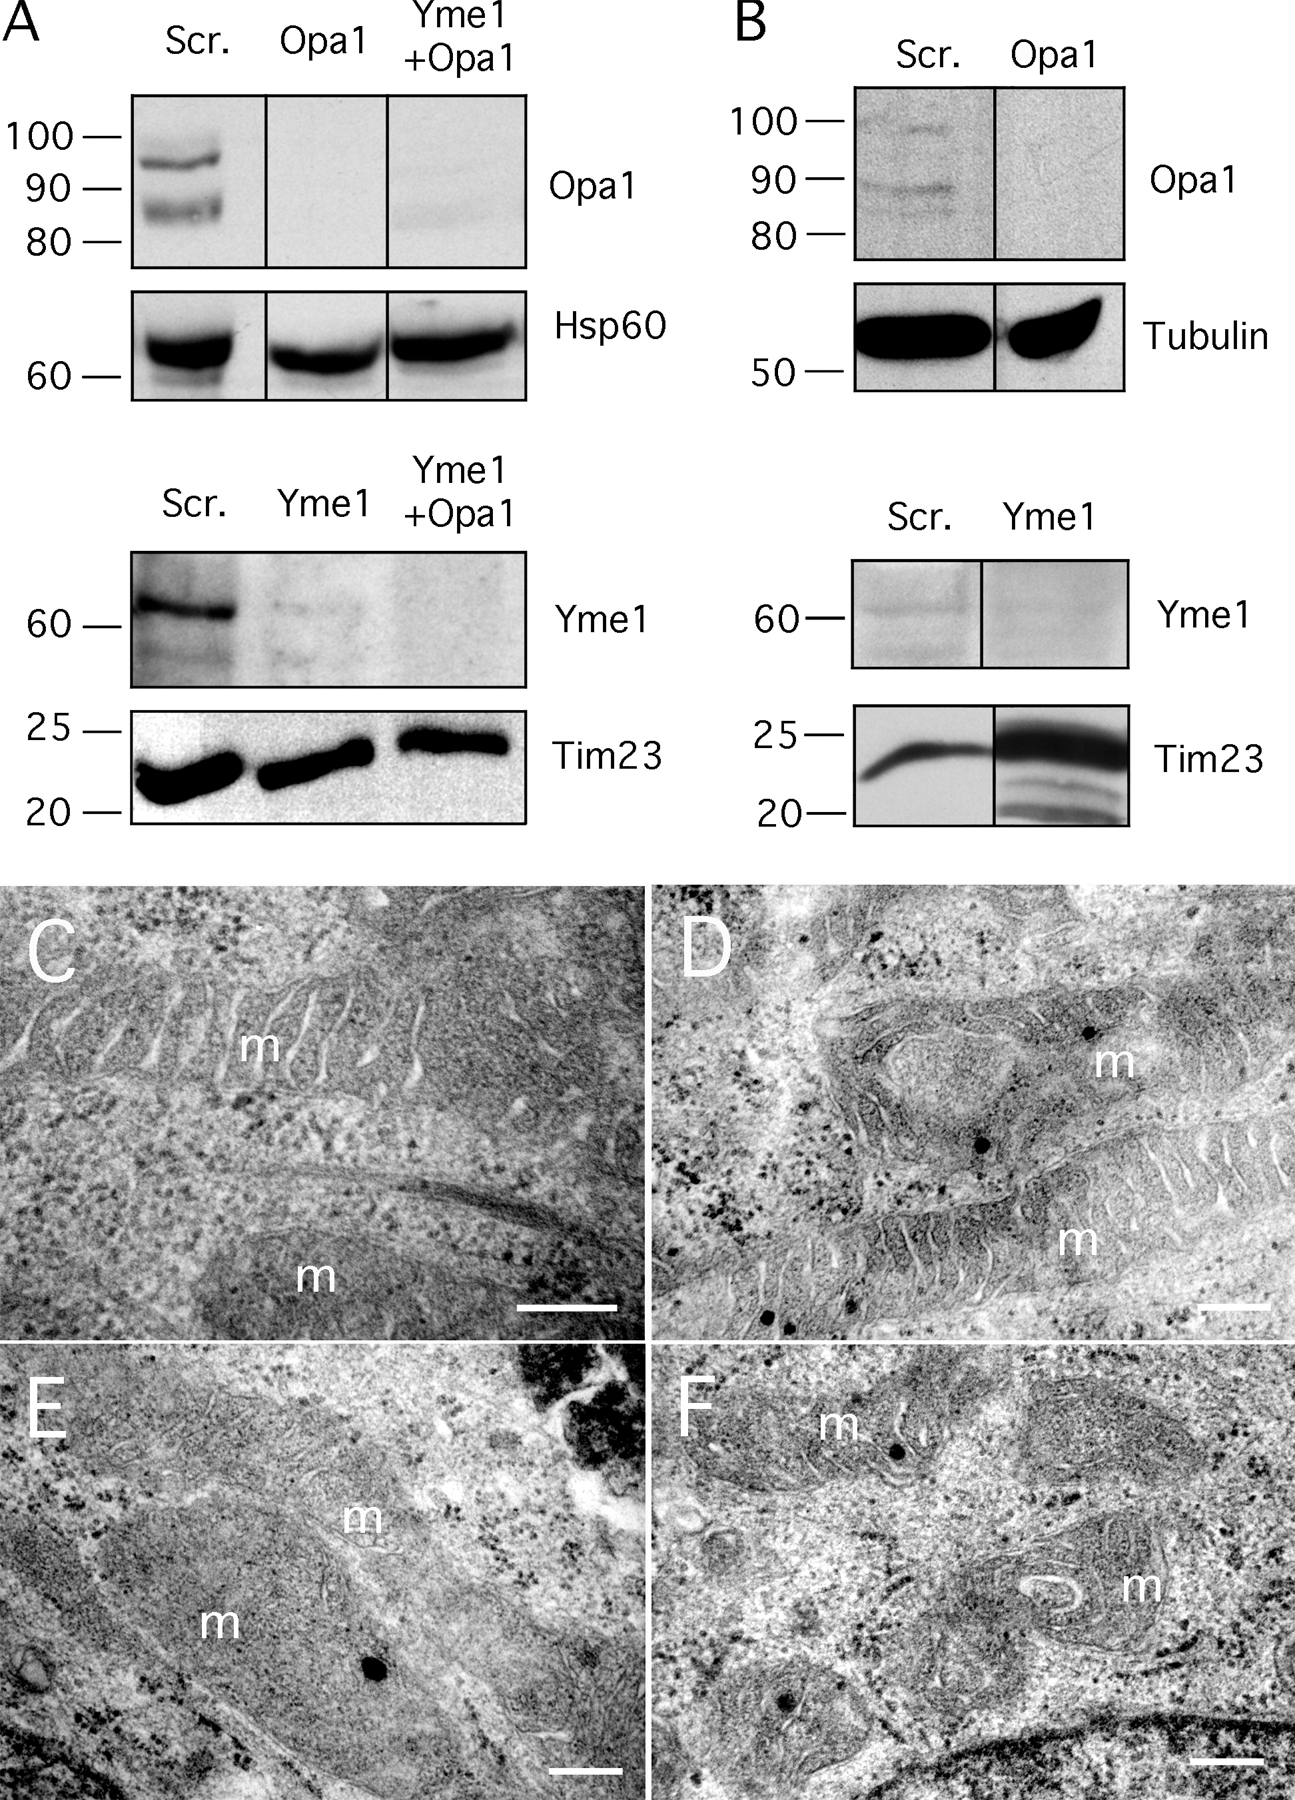
Figure S3. Knockdown of Opa1 and Yme1 in single and double siRNA transfection experiments. (A and B) Western blots showing Opa1 and Yme1 expression levels. Hsp60, Tim23, and tubulin serve as loading controls. Opa1, Hsp60, and tubulin were detected by blotting whole cell extracts, whereas Yme1 and Tim23 were detected by blotting mitochondria that were isolated with differential centrifugation. (A) Samples that were processed in parallel with Mitotracker staining (Fig. 3). (B) Samples that were processed in parallel with electron microscopy (C-F). (C) An electron micrograph of mitochondria (labeled m) in a cell transfected with Yme1 scrambled oligonucleotides as a control. (D) Mitochondria in a cell transfected with Drp1 siRNA as an additional control. (E) Mitochondria in a cell transfected with Yme1 siRNA. (F) Mitochondria in a cell transfected with Yme1 and Opa1 siRNA oligonucleotides. The micrographs show normal cristae morphologies in Drp1 siRNA cells and normal or at best mildly disrupted cristae morphologies in Yme1 and Yme1/Opa1 siRNA-transfected cells. Cells were prepared for electron microscopy by fixing for 30 min in 2% glutaraldehyde (Ted Pella, Inc.), washing with PBS, and incubating for 1 h with 1% osmium tetroxide. The samples were then dehydrated and embedded in Epon resin. 70-nm-thick sections were stained with uranyl acetate and lead citrate. The sections were viewed with an electron microscope (100CX; JEOL). Bars, 200 nm.