[View Larger Version of this Image]
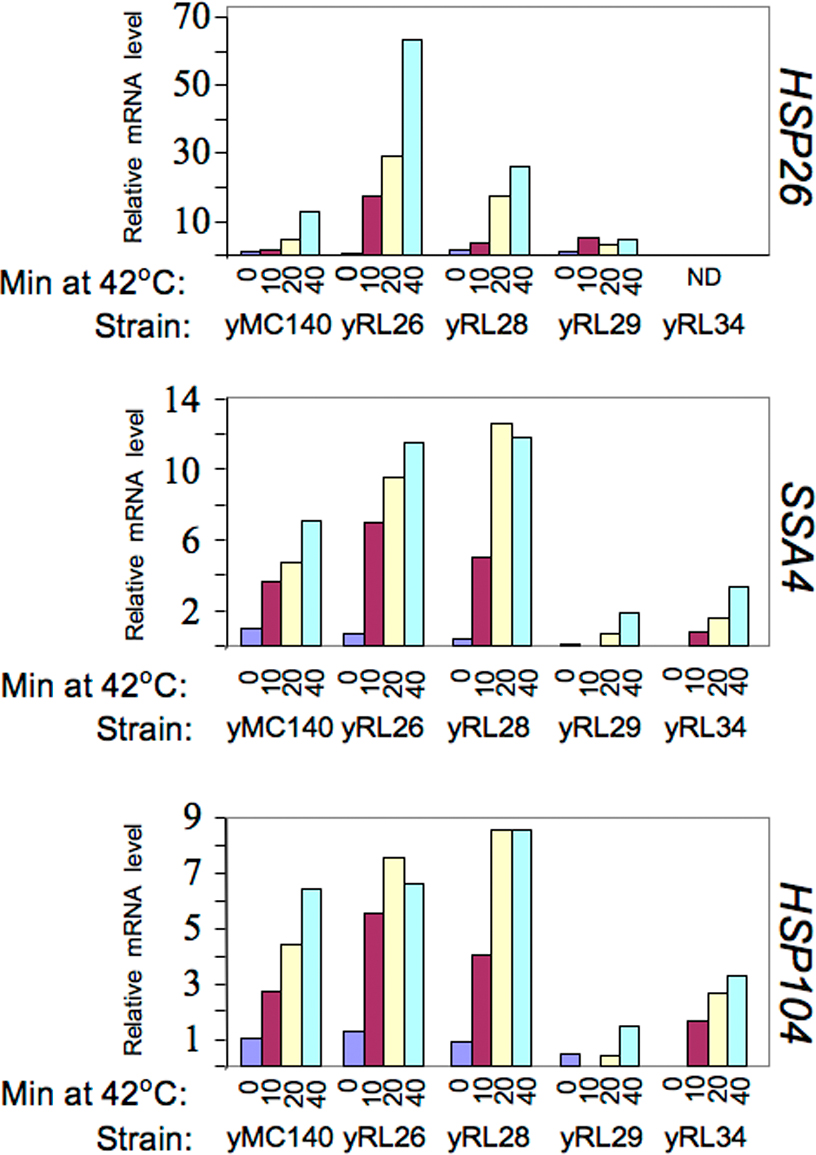
Figure S2. Transcriptional capacity of various rpb7 ts mutants. The indicated strains were proliferated at 30°C until mid-log phase and then shifted abruptly to 42°C. Cells were harvested at the indicated time points and the levels of their mRNAs were analyzed using the probes indicated on the right. The membrane was finally probed with 18S rRNA. Band intensities were quantified by PhosphorImager and normalized to that of the rRNA. The normalized intensity at time 0 (before temperature increase) in the WT strain was defined as 1 and the intensities at the other time points in this and all other strains were calculated relative to time 0 in the WT. Quantification was done once. ND, not determined.