[View Larger Version of this Image]
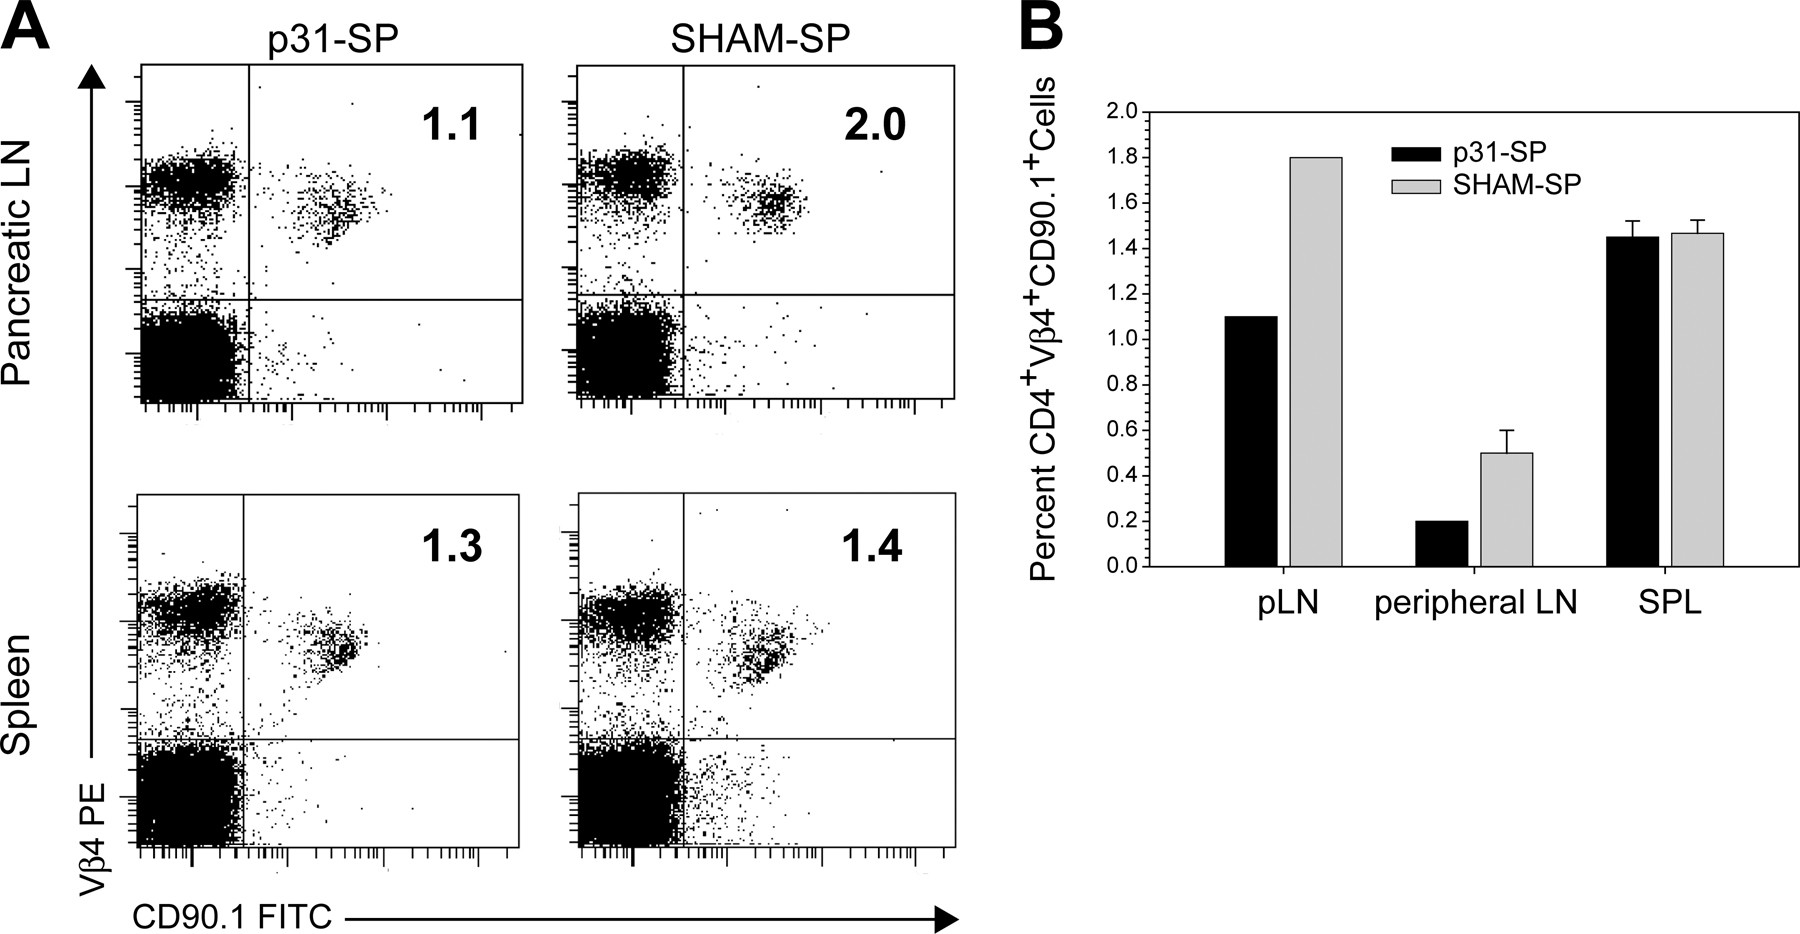
Figure S1. Ag-SP-tolerized cells persist and remain nonresponsive. Diabetes was induced by BDC2.5 T cell transfer to NOD mice. 24 h later, recipients received either p31-SP or SHAM-SP. (A) 4 wk after Ag-SP therapy, CD4+CD90.1+ BDC2.5 T cells from pLNs and spleens were determined from p31-SP- and SHAM-SP-treated mice. Representative dot plots are shown with the percentages of BDC2.5 CD4+ T cells in the top right quadrant. (B) The average percentage of BDC2.5 cells ± SEM is shown from pLNs, peripheral LNs, and spleens from p31-SP (black bars) or SHAM-SP (grey bars) from three mice per group.