[View Larger Version of this Image]
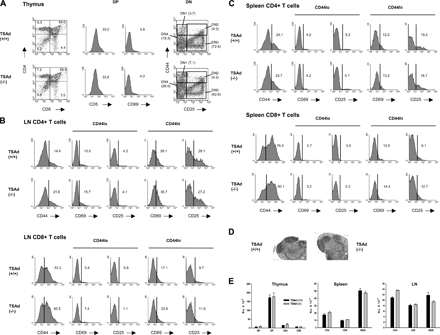
Figure S3. Flow cytometric and histological analysis of primary and secondary lymphoid organs from 6 wk old C57BL/6 wild-type and TSAd-deficient mice. (A) Thymus. Shown are plots of CD4 versus CD8 expression on whole thymocytes (left), CD5 and CD69 expression on CD4+CD8+ double-positive (DP) thymocytes (middle), and CD44 versus CD25 expression on CD4|CD8| double-negative (DN) thymocytes (right). Figures on whole thymus and DN plots indicate percentage representation of respective populations. Figures on DP plots indicate mean fluorescence intensity. The location of DN populations 1-4 are indicated on DN plots. No significant differences in the ratio of DN subsets, DP and CD4+ or CD8+ (SP) T cells nor in the expression of CD5 or CD69 on DP T cells can be discerned between TSAd (+/+) and (|/|) mice consistent with a lack of influence of TSAd upon thymic selection processes. (B and C) Shown is the expression of CD69 and CD25 activation markers on CD44lo (naive) and CD44hi (memory) CD4+ and CD8+ T cells in LN (B) and spleen (C). Figures denote percentage positive cells (right of the indicated markers). No significant differences in the ratio of naive to memory T cells nor the expression of CD69 and CD25 upon naive or memory T cells is apparent between TSAd (+/+) and (|/|) mice at this age showing that TSAd (|/|) T cells have not undergone any increased prior stimulation relative to TSAd (+/+) T cells. (D) H&E stained sections of LN revealing normal lymphoid architecture in TSAd (|/|) mice. Similarly, architecture of thymus and spleen is normal in TSAd (|/|) mice at this age. (E) Absolute numbers of DN, DP, and SP T cells in thymus and CD4+, CD8+, and B220+ B cells in LN and spleen. Values represent means plus 1 SE of three mice of each genotype. No significant differences are apparent.