[View Larger Version of this Image]
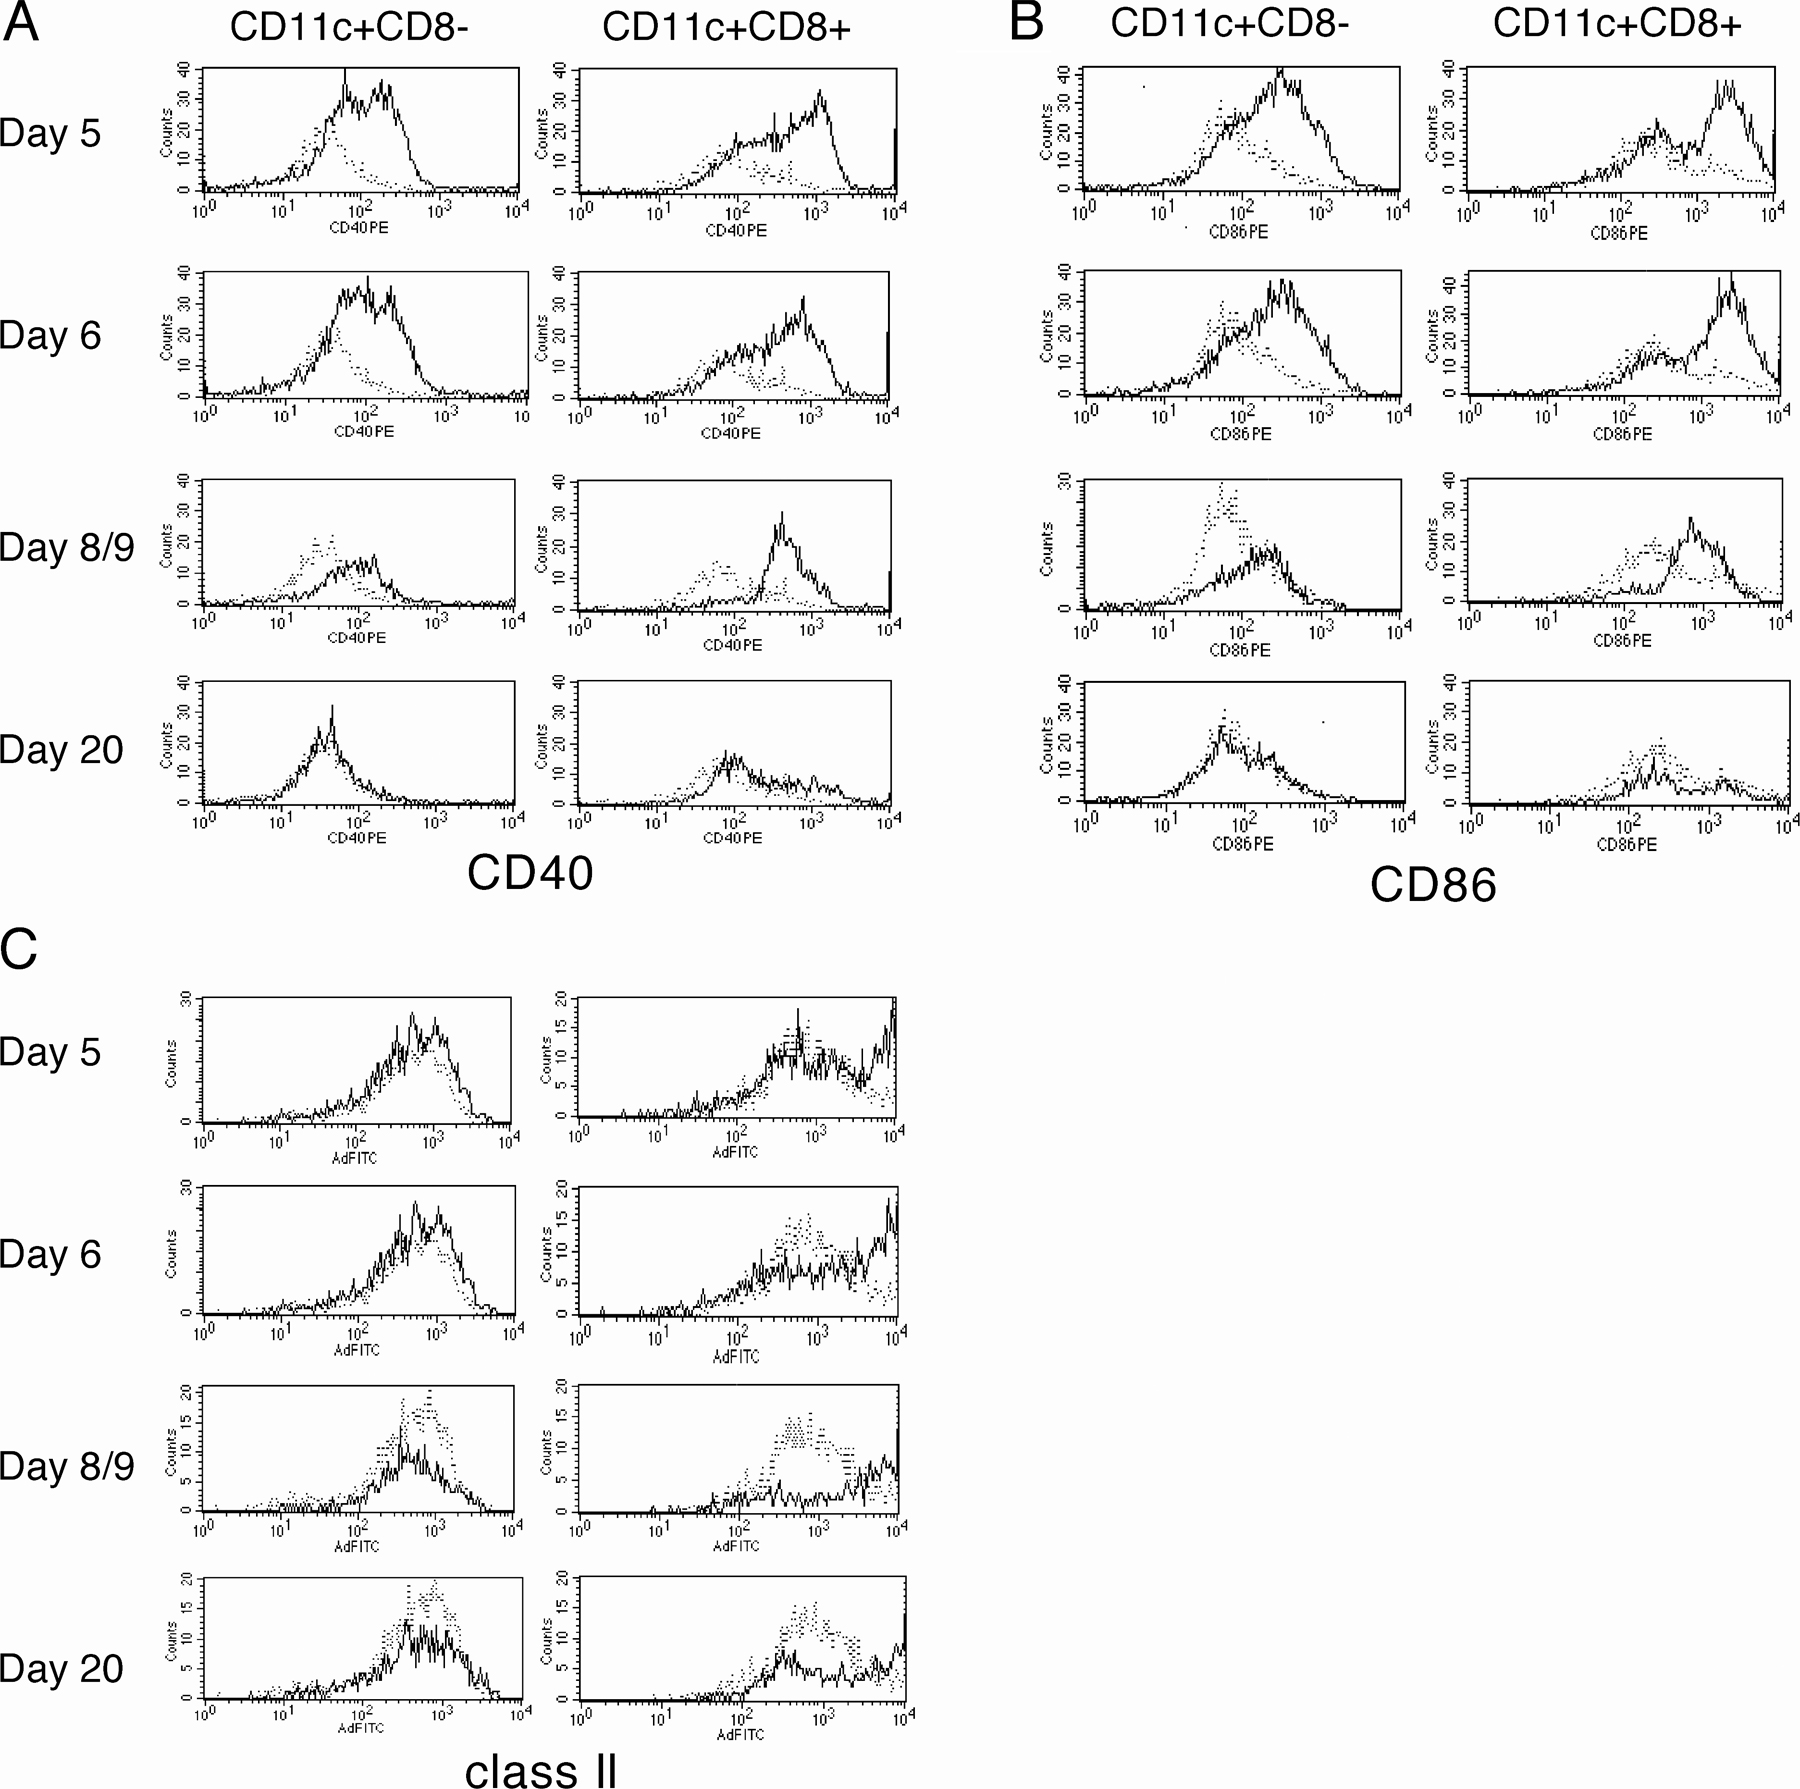
Figure S2. Expression of MHC class II and costimulatory molecules on CD11c+CD8+ and CD8- DCs. Histograms show the expression of CD40 (A), CD86 (B), and MHC class II I-Ad (C) on splenic CD11c+CD8- and CD11c+CD8+ DCs of naive (dotted line) and infected mice (solid line). Live cells were gated on forward light scatter and 90° scatter. Data shown are individual mice and are representative of at least 10 animals.