[View Larger Version of this Image]
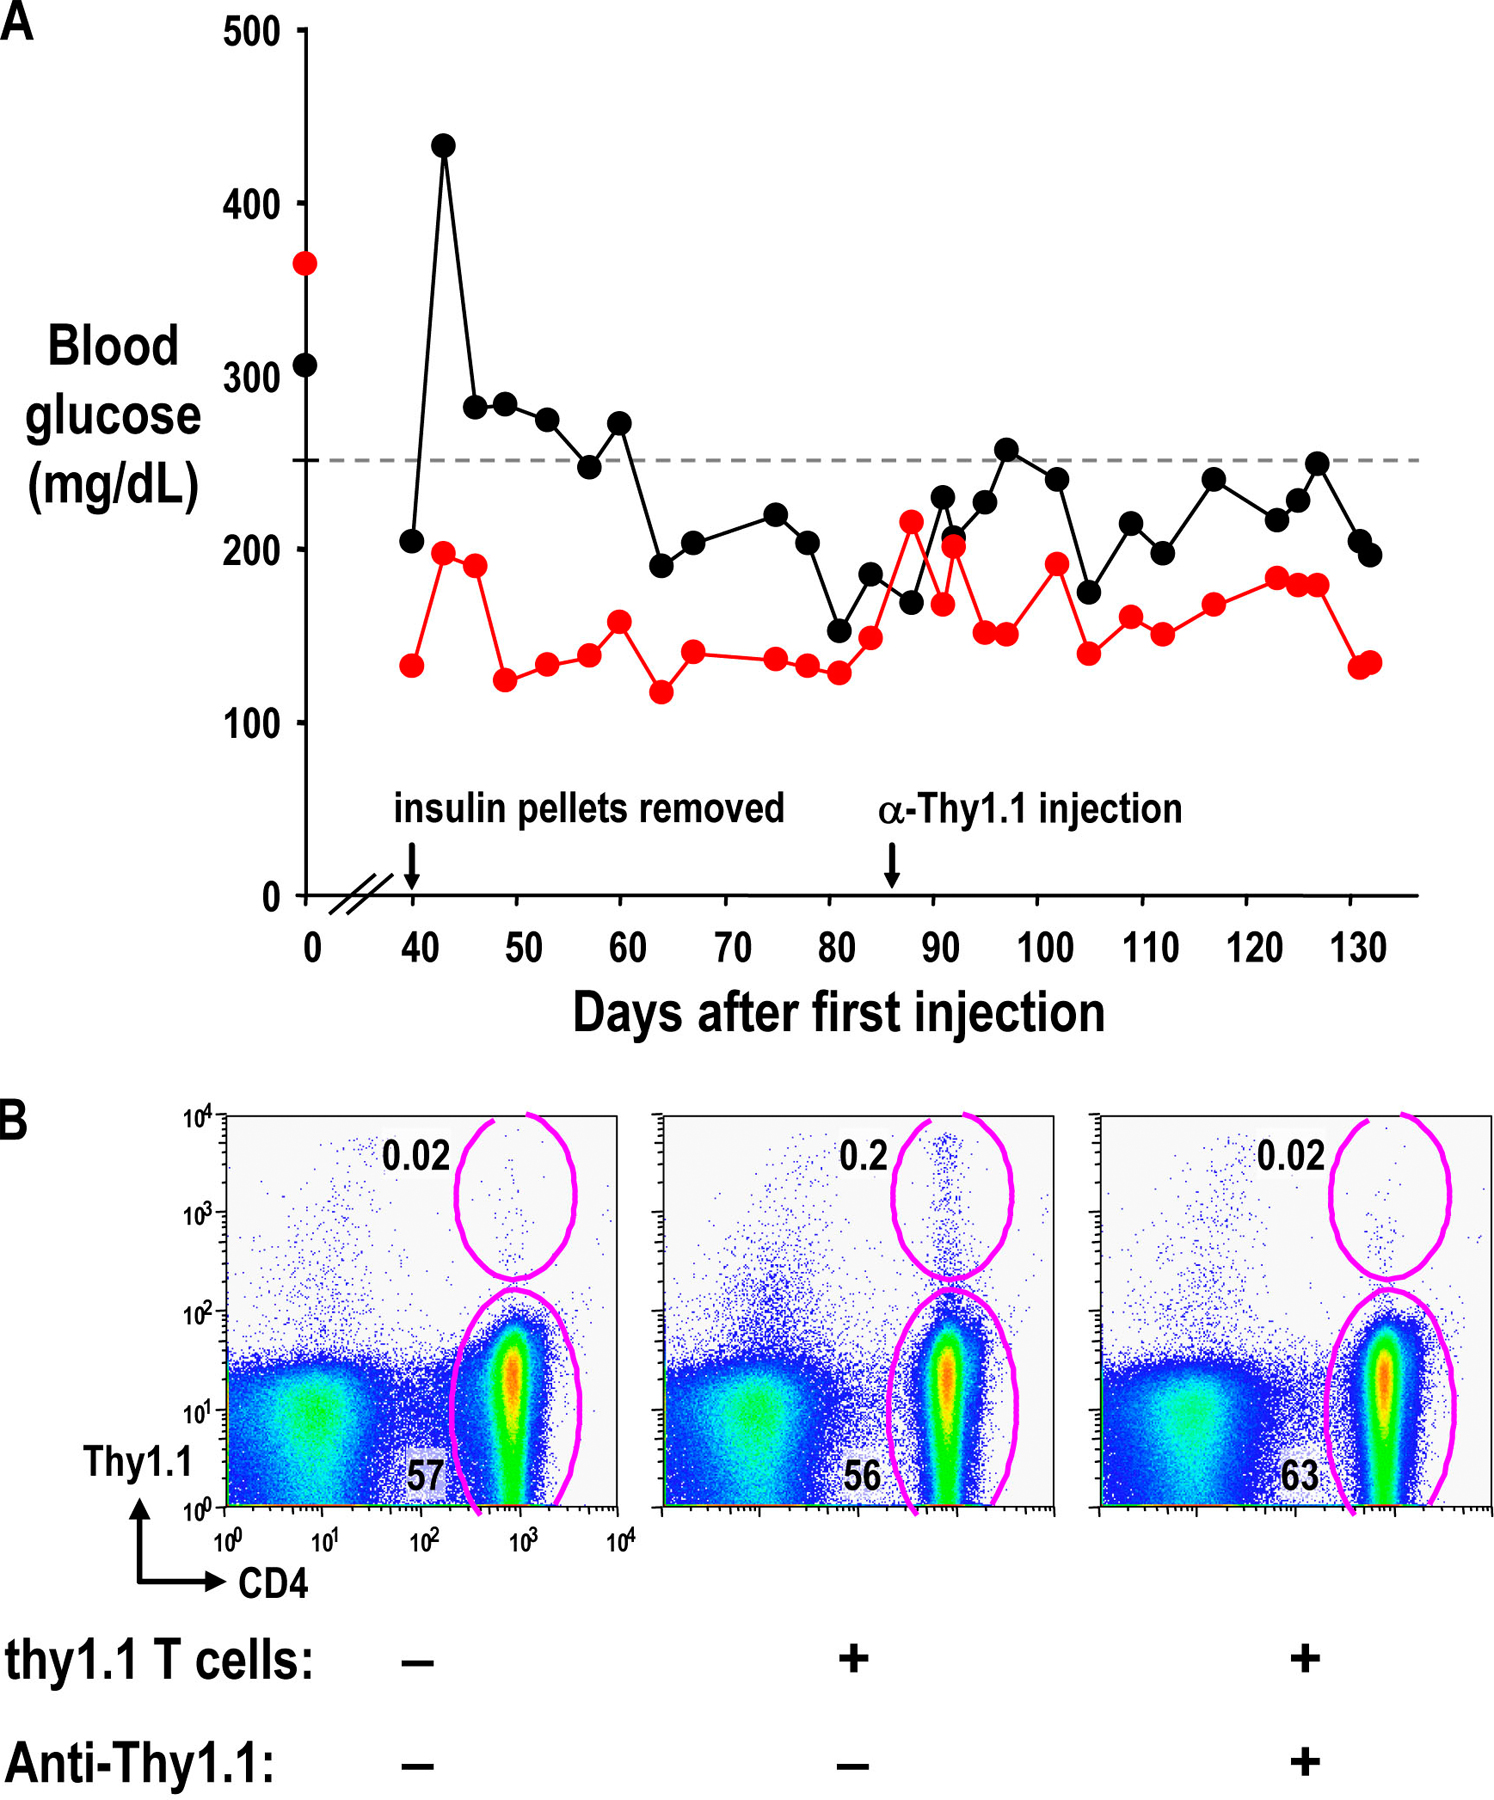
Figure S4. Depletion of Thy1.1+ cells with anti-Thy1.1. (A) Blood glucose levels for mice successfully treated with Thy1.1+ BDC T reg cells (protocol as shown in Fig. 3 B) were measured on the indicated days. Insulin pellets were removed on day 40 (left arrow), and 100 µg anti-Thy1.1 was injected on day 86 (right arrow). (B) NOD Thy1.2 mice were injected with no cells (left) or 5 x 10⁶ CD4 T cells from Thy1.1 NOD mice (middle and right), followed 1 day later by 100 µg anti-Thy1.1 (right). After 7 d, lymph nodes were harvested. The plots shown are gated on live lymphocytes, and the percentages of CD4+Thy1.1+ and CD4+Thy1.1- cells are shown.