[View Larger Version of this Image]
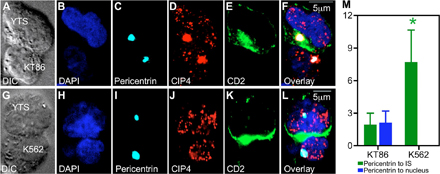
Figure S1. Localization of CIP4 and the MTOC relative to the NK cell nucleus in cytolytic and noncytolytic conjugates. The cytolytic synapse (A-F) between a YTS CD2-GFP and KT86 cell, and a noncytolytic synapse (G-L) between a YTS CD2-GFP and K562 cell are shown using DIC microscopy (A and G), as well as confocal microscopy demonstrating fluorescence for DAPI (B and H), pericentrin (C and I), CIP4 (D and J), CD2-GFP (E and K), and an overlay of all fluorescent channels (F and L). Images depict an x-y plane that was selected to highlight the MTOC. Disproportionate accumulation of CIP4 in other z planes was not found. (M) The mean distances (in micrometers) measured from the centroid of the pericentrin-defined MTOC to the IS (green bars) and nucleus (blue bars) in YTS cells engaged in cytolytic (KT86; n = 10) or noncytolytic (K562; n = 10) conjugates are shown. Error bars represent the SD. The distance to the IS was defined as the shortest distance from the centroid of the pericentrin-defined MTOC to the accumulated CD2 and was greater in YTS cells in noncytolytic conjugates with K562 target cells (*, P