[View Larger Version of this Image]
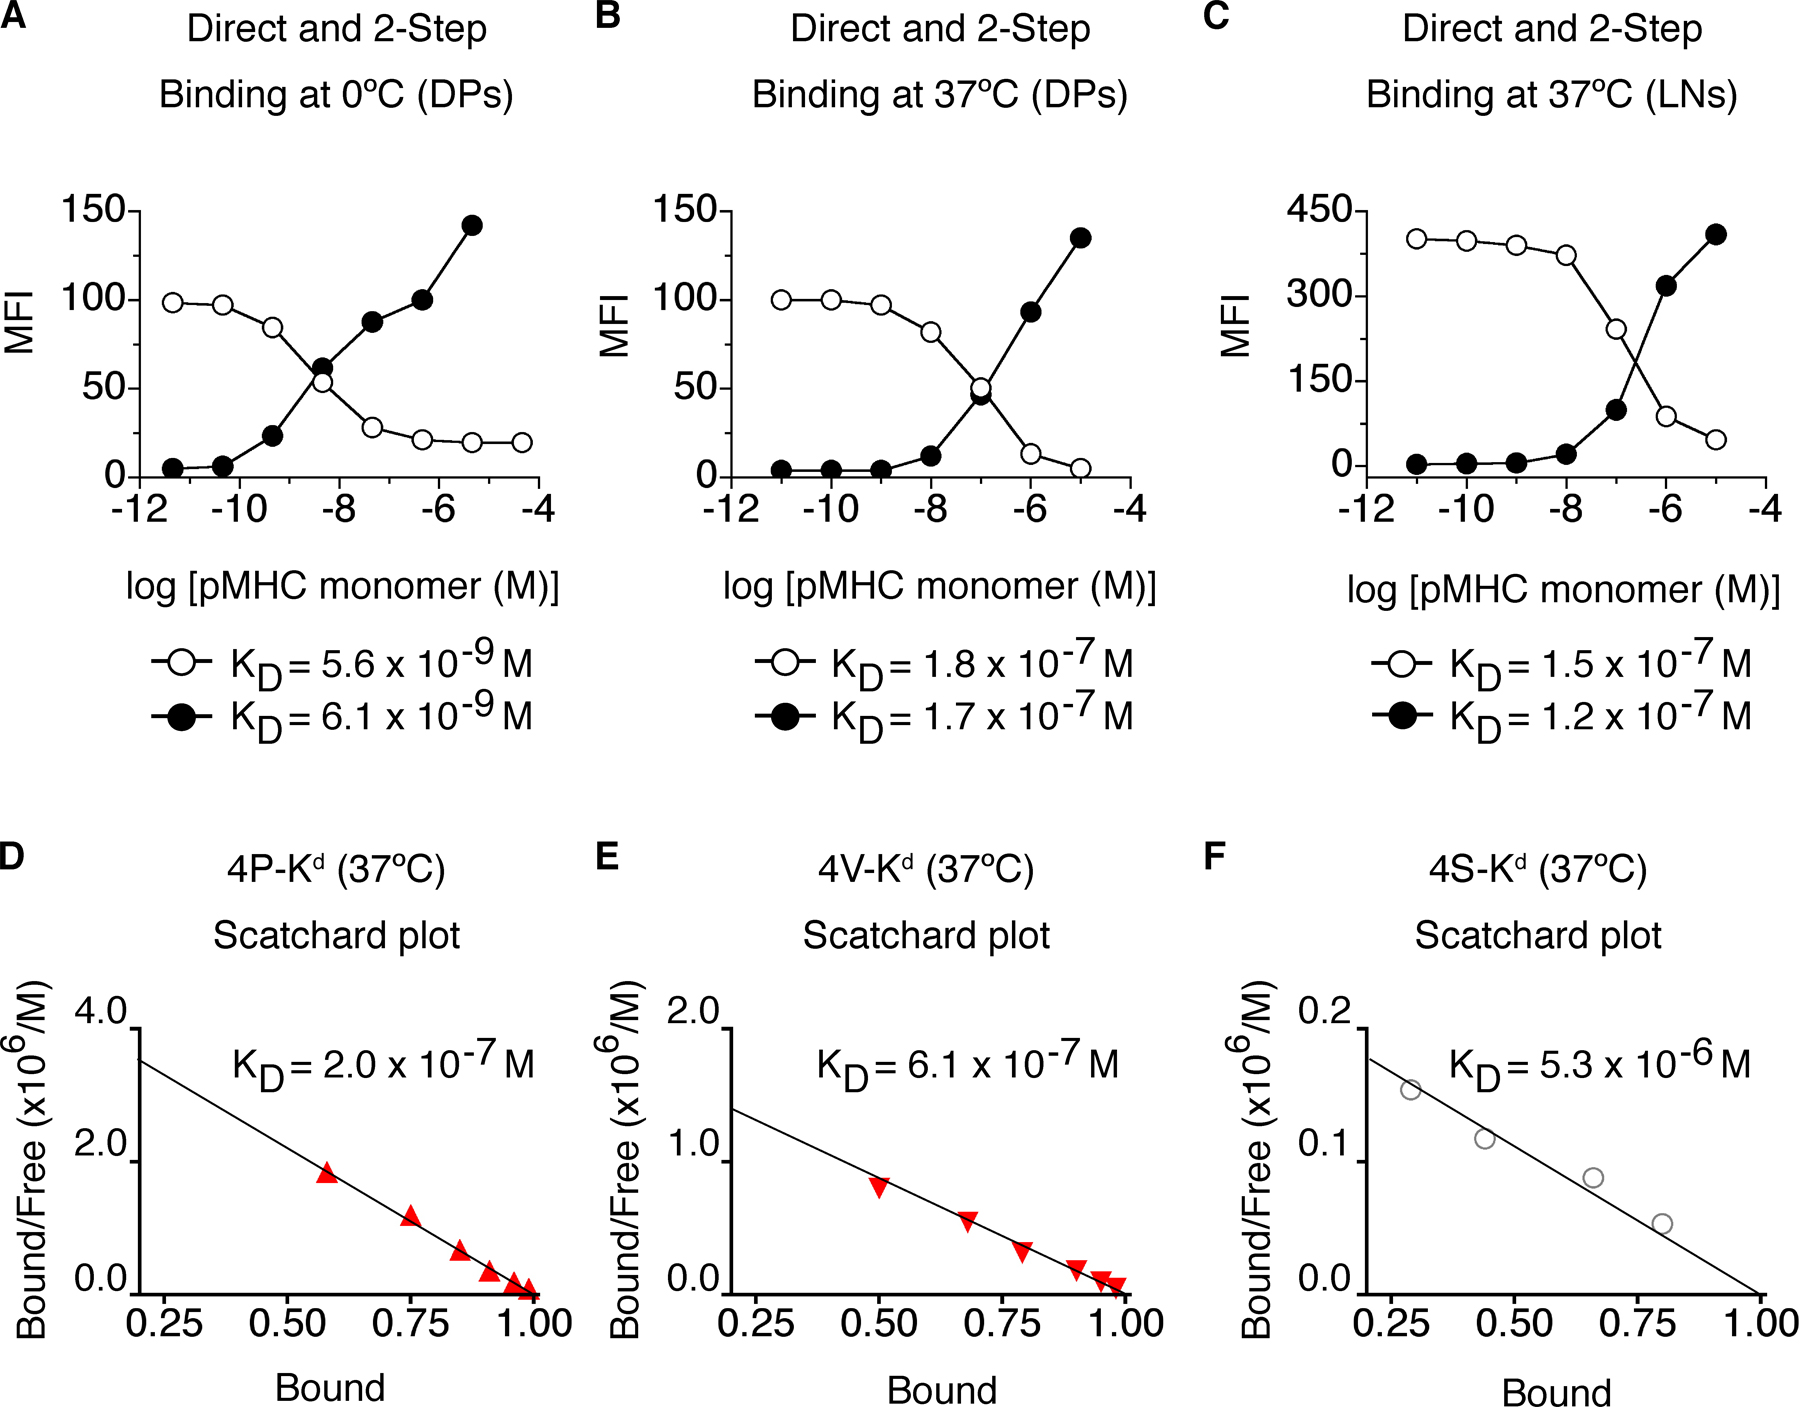
Figure S1. TCR-CD8/pMHC apparent affinity measurements. (A–C) Comparison of fluorescence signals obtained using the direct (●) or the two-step (○) photoaffinity labeling methods. T1 TCR DP thymocytes labeled at 0°C (A) and 37°C (B), or LN T cells labeled at 37°C (C). Signals from the two-step method (○) represent the fraction of unbound, free TCRs. Higher fluorescence signals observed on LN T cells (C) compared with DP thymocytes (A and B) were caused by increased TCR expression on LN T cells (not depicted). Nonlinear regression analysis revealed no significant differences between Kd values determined by either method (indicated below each graph). Scatchard analysis of 4P-Kd (D), 4V-Kd (E), and 4S-Kd (F) monomer binding to DP thymocytes of T1 TCR mice at 37°C. Kd values determined by nonlinear regression (B) or Scatchard analysis (D) gave similar results (compare values in D–F with data in Table S2).