[View Larger Version of this Image]
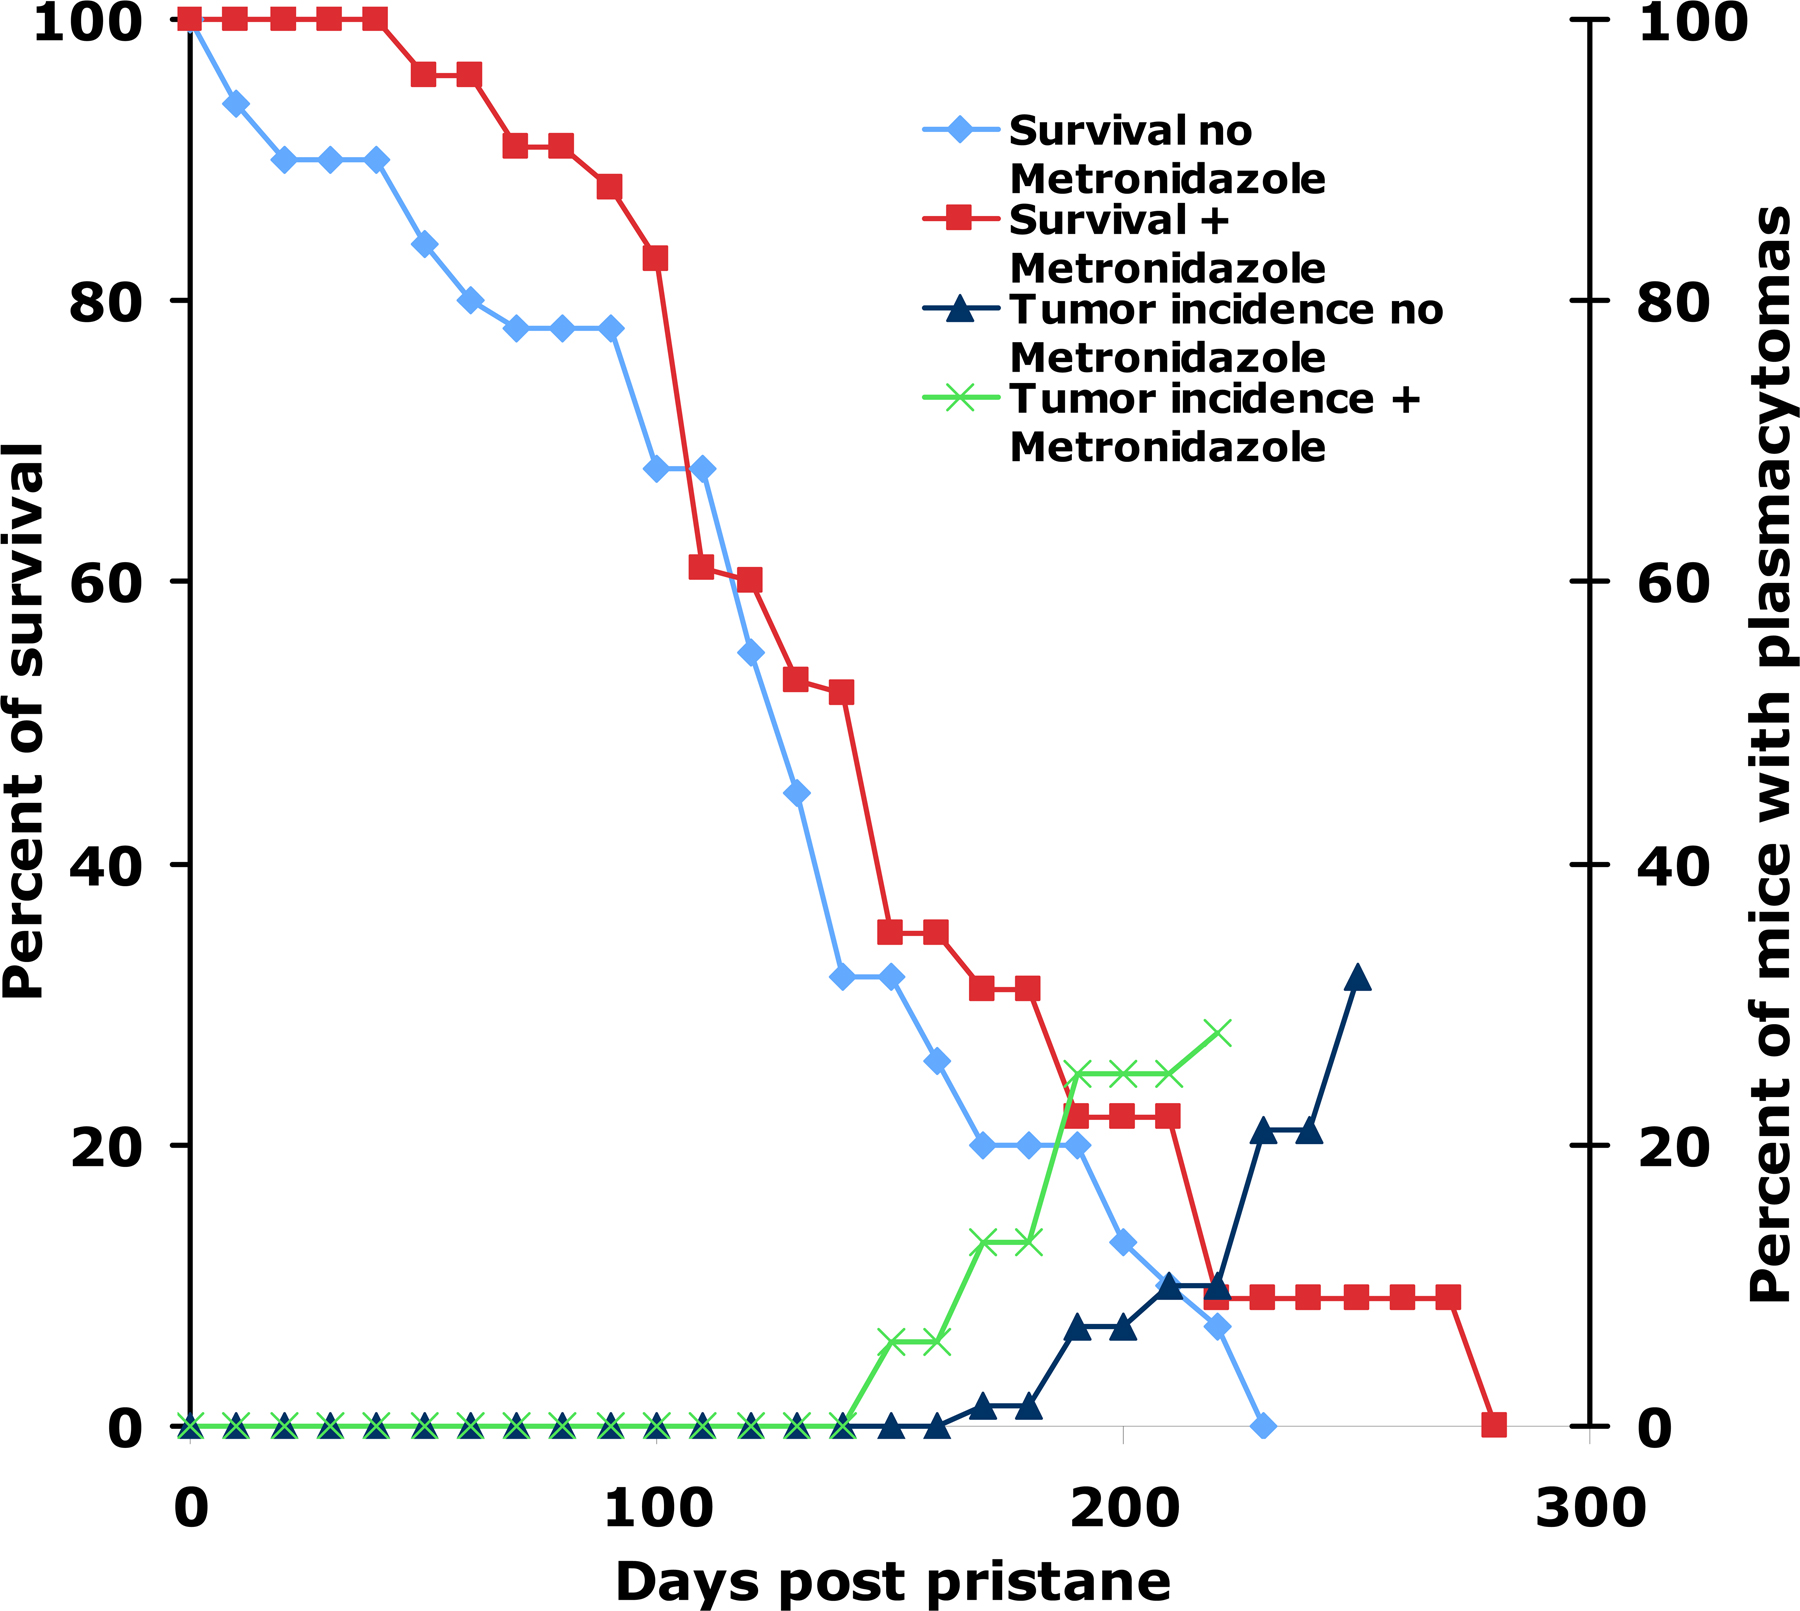
Figure S1. Survival time and incidence of plasma cell tumors in pristane-treated Aicda−/− BALB/cAnPt mice. The survival curves are for two groups of pAicda−/− backcross mice. The mice were either treated with metronidazole in the diet (red squares) or not (blue diamonds). The two ascending curves represent the percentage of pAicda+/+ mice with PCTs. Note that most of the pAicda−/− mice had died by the time plasma cell tumors began appearing.