[View Larger Version of this Image]
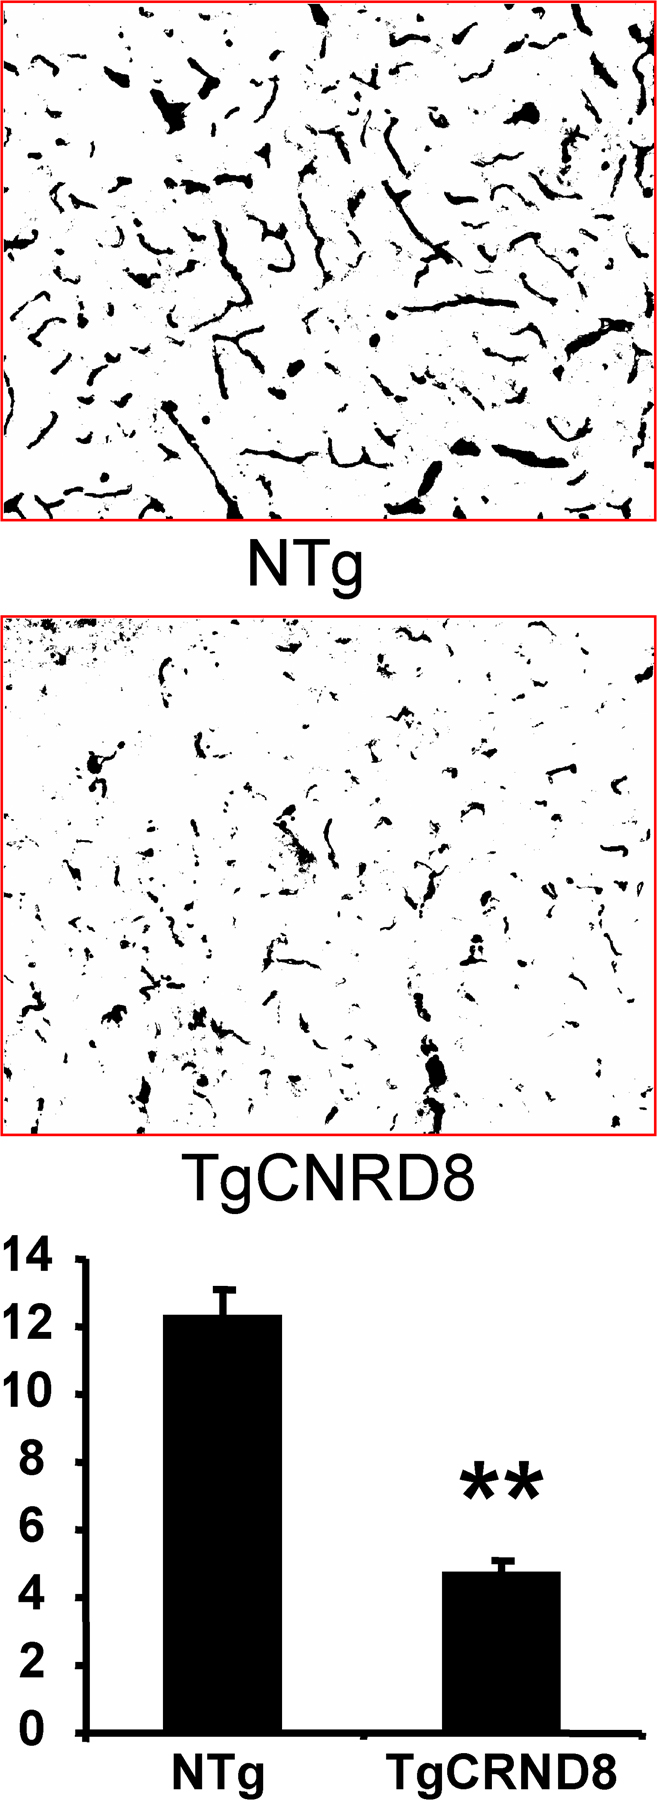
Figure S1. Representative examples of immunofluorescent images of brains labeled for PECAM-1 in TgCRND8 and nontransgenic (NTg) littermates, quantified by percentage of image area. **, P