[View Larger Version of this Image]
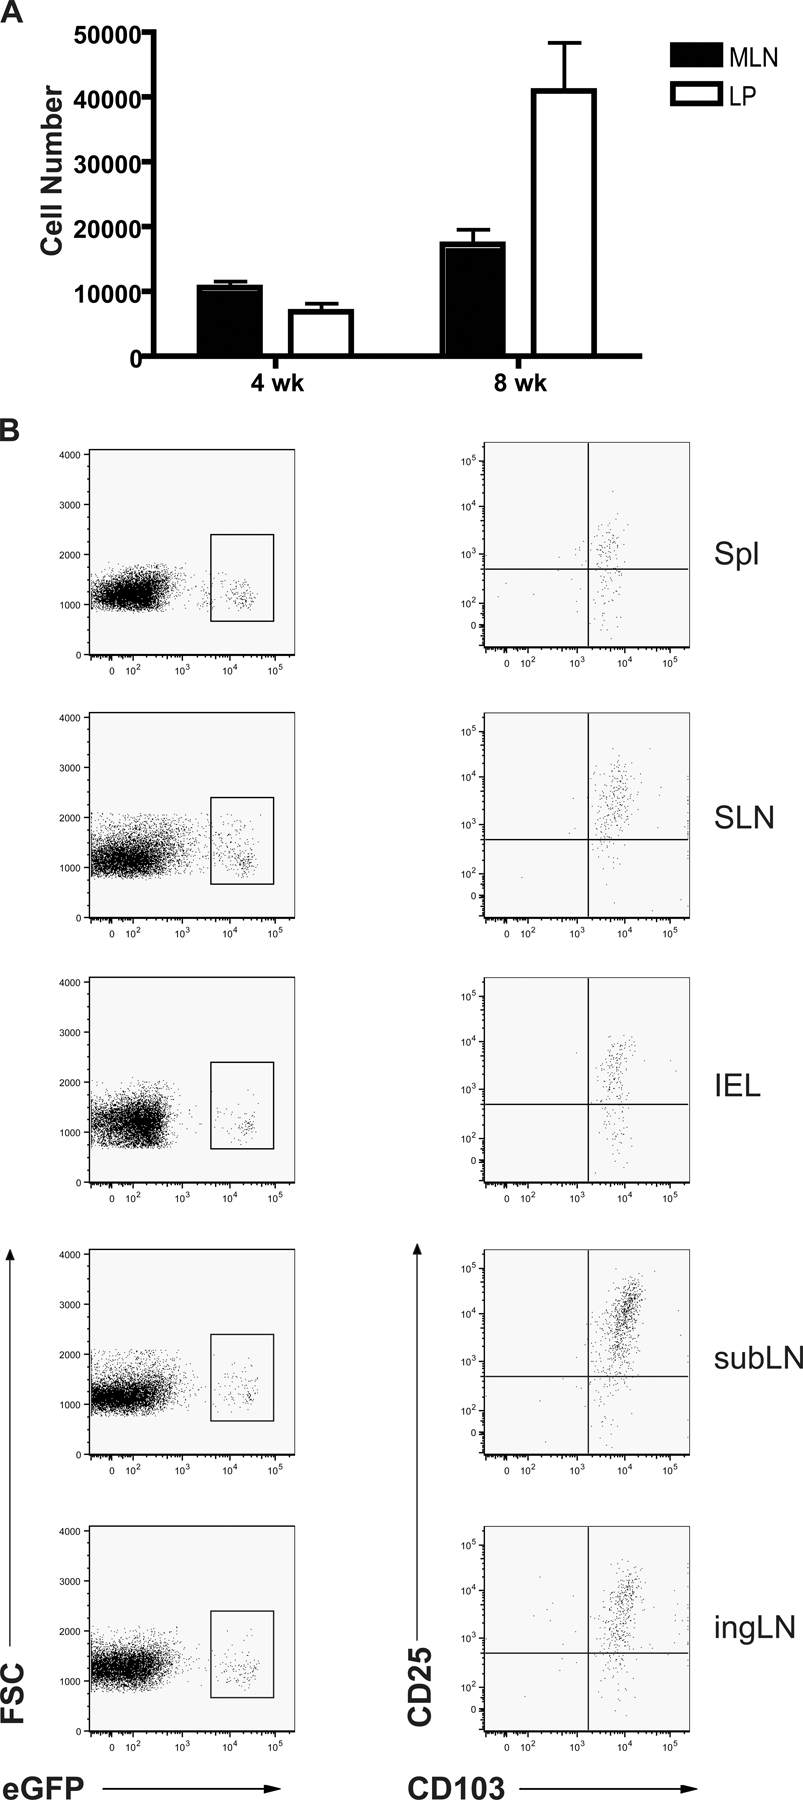
Figure S1. Number of converted cells after transfer of GFP2 cells into RAG-12/2 hosts. (A) Total numbers of converted GFP+ cells were determined in MLNs and Lps at 4 and 8 wk after transfer. Results are from two separate cell transfer experiments that were performed identically with at least three mice per group. Number of converted cells increases from 4 to 8 wk after transfer. CD25 and CD103 expression on converted eGFP+ T cells in multiple tissues. Error bars represent the SD. (B, left) Cells from spleen (Sp), stomach lymph node (SLN), intraepithelial lymphocytes, subLN, and ingLN were gated on Ly5.2 and CD4, and eGFP fluorescence was measured by FACS. (right) eGFP+ cells from these tissues also uniformly express CD103 and varying levels of CD25. Results shown here are representative of at least four experiments.