[View Larger Version of this Image]
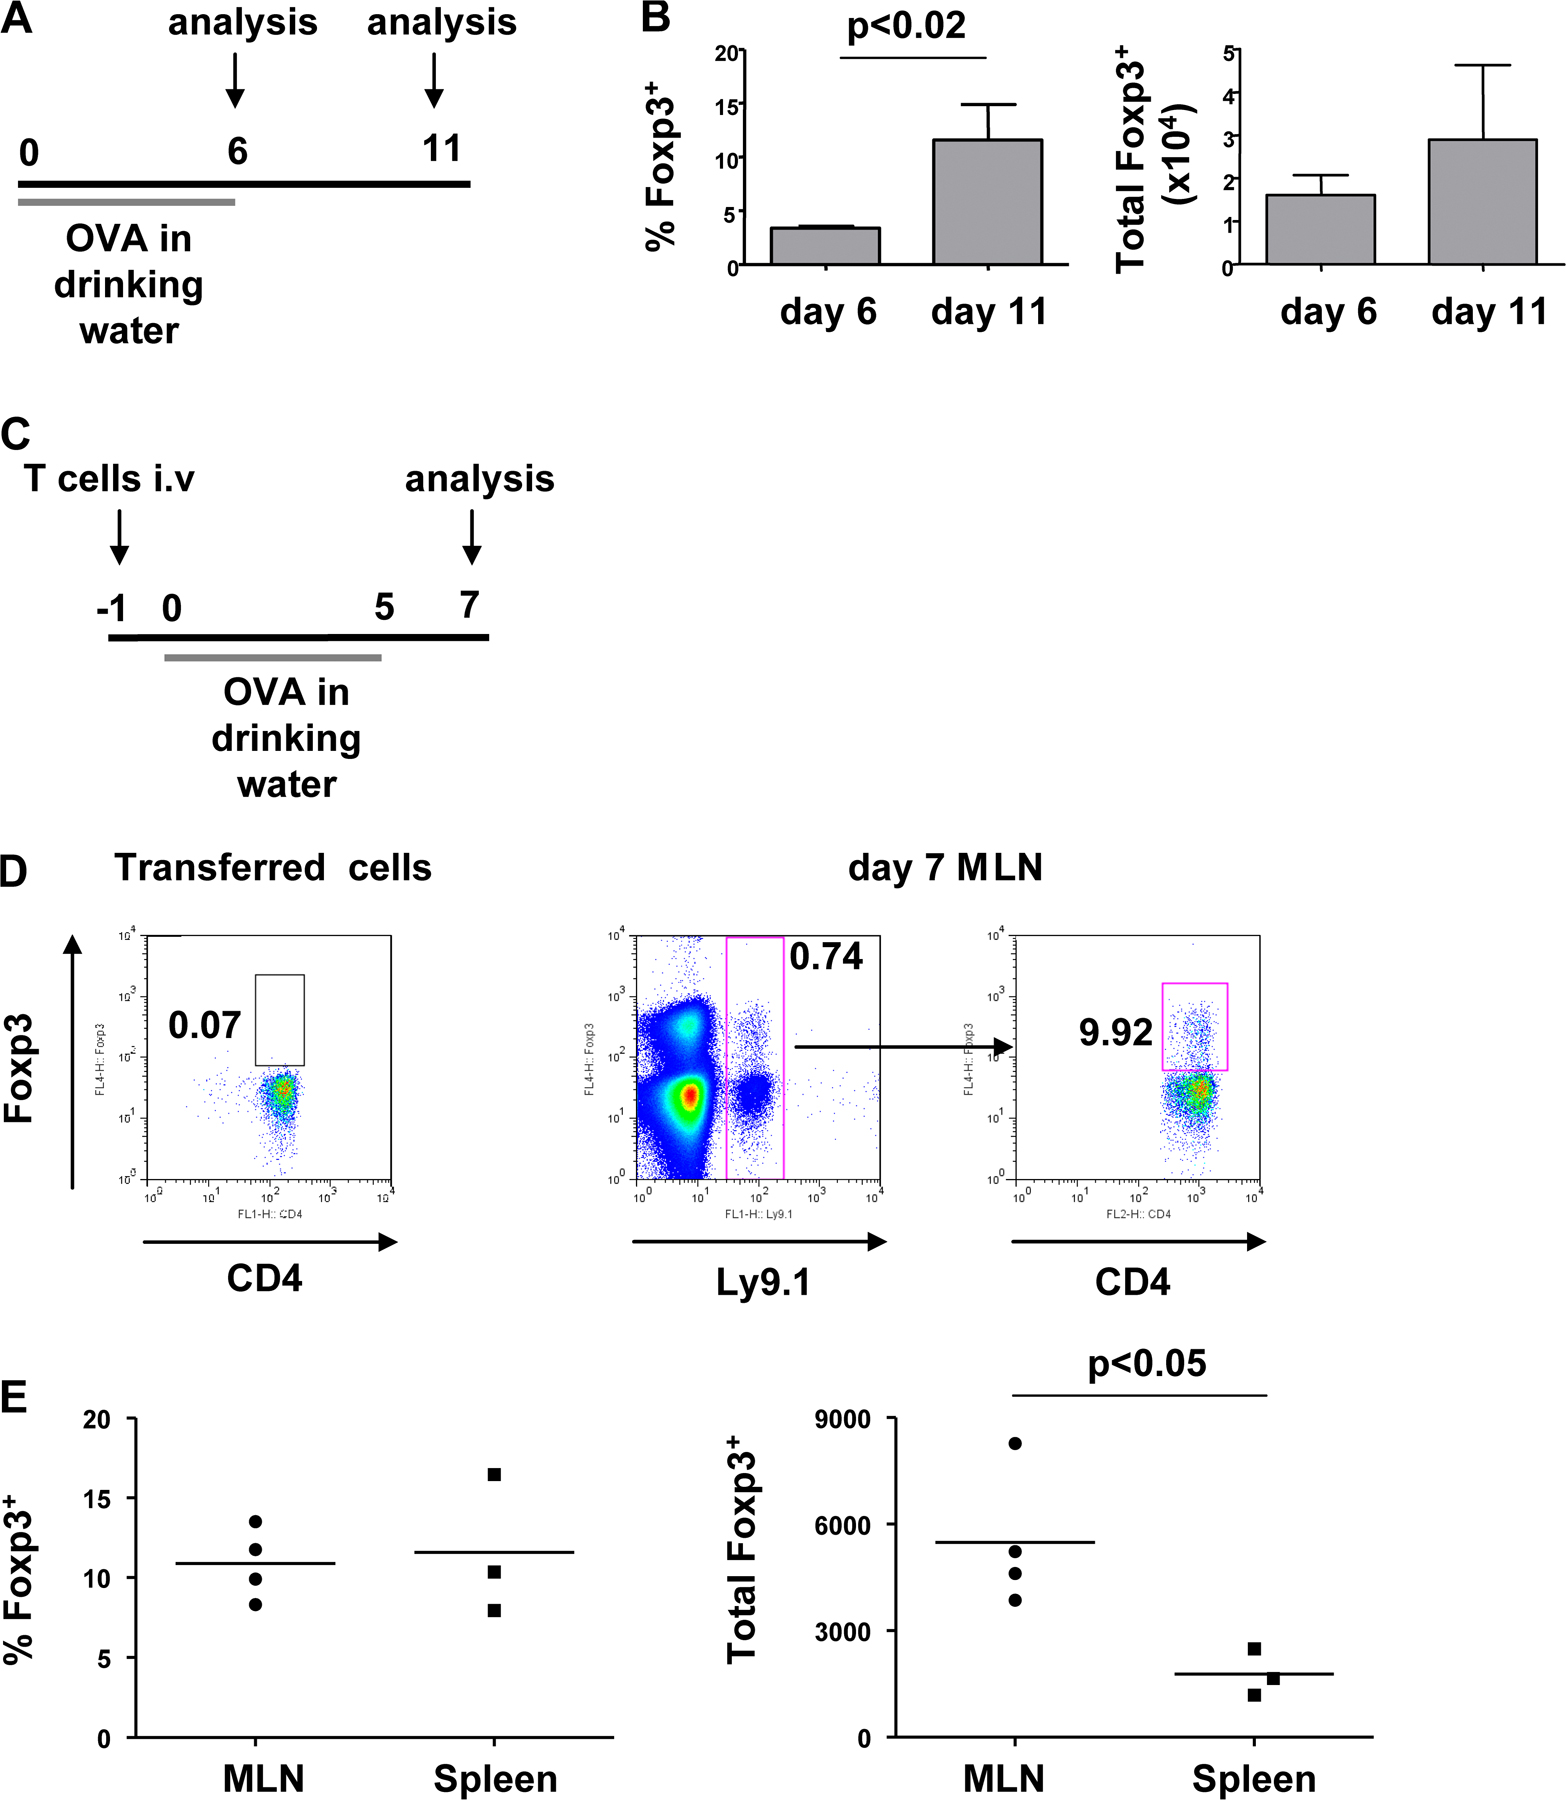
Figure S1. Foxp3+ T cells are generated in the GALT. (A and B) DO11.10 SCID mice were given OVA in drinking water for 6 d and returned to normal drinking water for an additional 5 d. (B) Single cell suspensions of MLNs of fed mice were stained for CD4 and Foxp3 and analyzed by FACS. Graphs depict mean ± SD of the total number and percentage of Foxp3+ T cells among CD4+ T cells at days 6 and 11. (C-E) Ly9.1+CD4+ T cells were isolated from DO11.10 SCID donors and injected i.v. into congenic Ly9.2 BALB/c recipients. Recipient mice were given OVA in drinking water for 5 d, and MLNs were analyzed for the presence of Foxp3+Ly9.1+ cells 2 d later. (D) Single cell suspensions of MLNs of fed mice were stained for Ly9.1, CD4, and Foxp3 and analyzed by FACS. Representative FACS plots are shown. (E) Graphs depict the percentage of transferred Ly9.1+ T cells expressing Foxp3 and the total number of Ly9.1+Foxp3+ T cells in each tissue.