[View Larger Version of this Image]
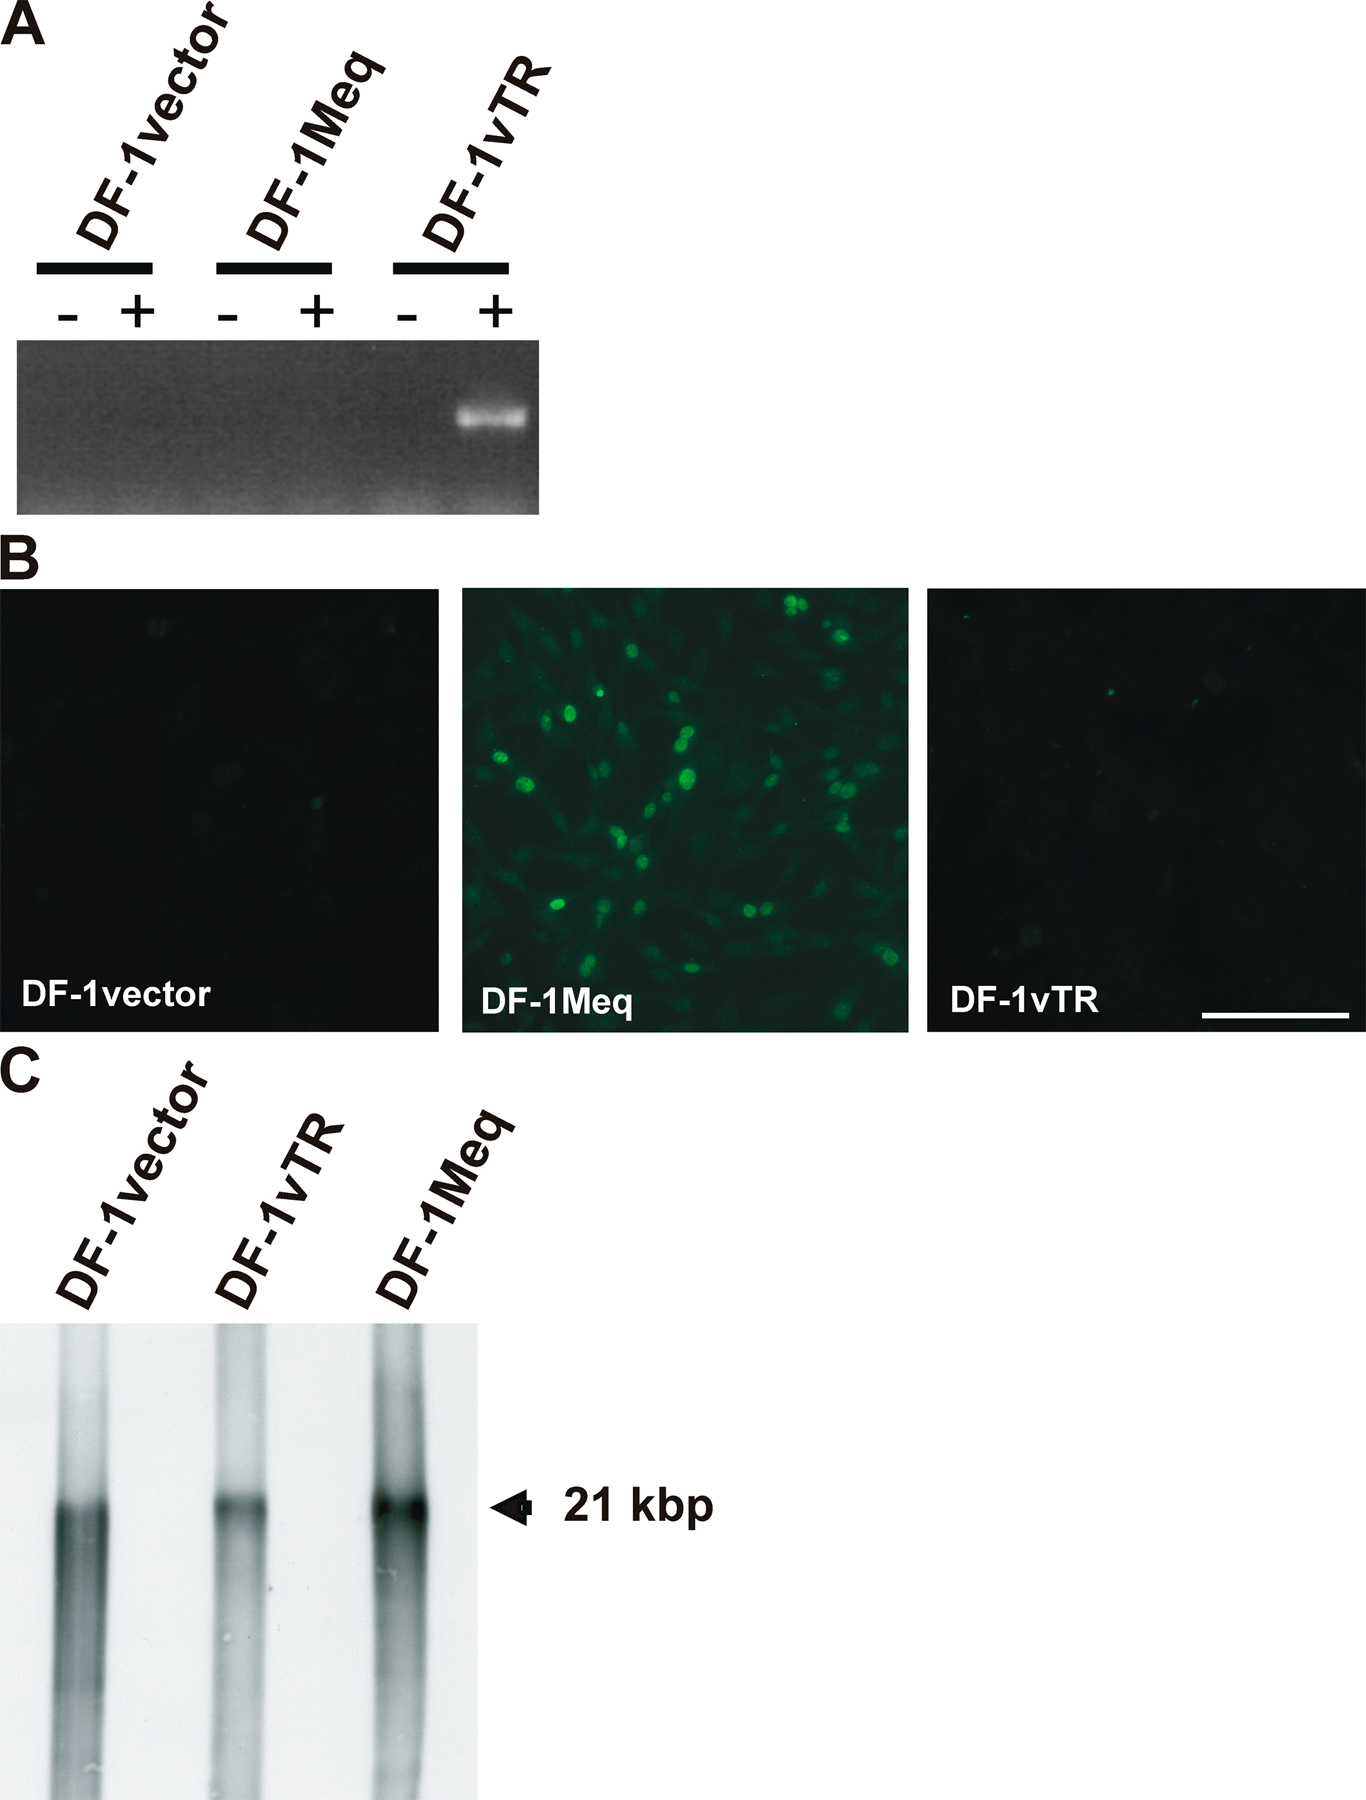
Figure S4. Stable expression of vTR and Meq in recombinant DF-1 cells and analysis of telomere lengths in the engineered cell lines. (A) An RT-PCR analysis of vTR expression in DF-1vector, DF-1Meq, and DF-1vTR cells is shown. Total RNA was extracted from the indicated DF-1 cell lines, and 2 µg total RNA of each extraction sample was subjected to an RT-PCR analysis. One-step RT-PCR was performed in the absence (-) or presence (+) of reverse transcriptase using oligonucleotide primers, vTR(exp)fw, 5′-GGCACACGTGGCGGGTGGAAGG-3′ and vTR(exp)Brv, 5′-CCGTTCGGTCGACTCA CAGAGC-3′. (B) Indirect immunofluorescence analysis of Meq expression in DF-1vector, DF-1Meq, and DF-1vTR cells. Cells of the indicated DF-1 cell lines were fixed with 90% acetone, and Meq expression was analyzed by performing IIF using a Meq-specific rabbit antiserum (provided by H.-J. Kung, University of California, Davis, Davis, CA). Meq expression was visualized with Alexa Fluor 488 goat anti-rabbit IgG (Invitrogen), examined under a fluorescence microscope (Bar, 50 µm), and photographed using a digital camera (Zeiss Axiovert 25 and Axiocam; Carl Zeiss MicroImaging, Inc.). (C) Southern blot analysis for comparison of terminal restriction fragment lengths in DF-1vTR, DF-1Meq, and DF-1vector cells. Cellular DNA was prepared using the PureGene kit (Gentra Systems), digested with HinfI and RsaI, and equal amounts were separated by 0.8% agarose gel electrophoresis. DNA was transferred to a nylon membrane (GE Healthcare) and hybridized with a digoxigenin-labeled telomere-specific probe (5′-TTAGGG-3′)7 (MWG Biotech). No differences in telomere length patterns between DF-1vector, DF-1vTR, or DF-1Meq cells could be identified, and the calculated size of the major telomere band is given.