Boncampagni et al. 10.1073/pnas.0709061104. |

Fig. 5. Percentage composition of muscles (A and C) and distribution of fiber diameters (B and D) of spinal cord injury (SCI) and functional electrical stimulation (FES)- trained patients. (A and C) Relative percentage occupied by muscle fibers, fibrous (collagene), adipose, and loose connective tissue: only 31% of the cross-sectional area in biopsies from SCI patients is occupied by of eosinophilic material, whereas the area occupied by muscle fibers is >90% in FES-trained patients. (B and D) The minimum fiber diameters were measured in at least 208 fibers in each SCI patient and in at least 107 fibers in each FES-trained patient. The number in each bin is expressed as percent of the total number of fibers. Fiber size distribution shows that in the denervated biopsies (B) >50% of the fibers have diameters <20 mm, whereas in FES-trained muscles >50% of fibers have a diameter >35 mm.

Fig. 6. Representative images of thinner (A; patient FES 2) and wider (B; patient FES 5) Z lines. In patients that were stimulated for shorter periods (FES 1 and 2) most fibers have thinner Z lines, whereas in patients that trained for longer periods (FES 3-5) fibers presenting wider Z lines are also present. See SI Table 3 for more detail. The dark spheres, which are visible in both micrographs, represent glycogen granules.

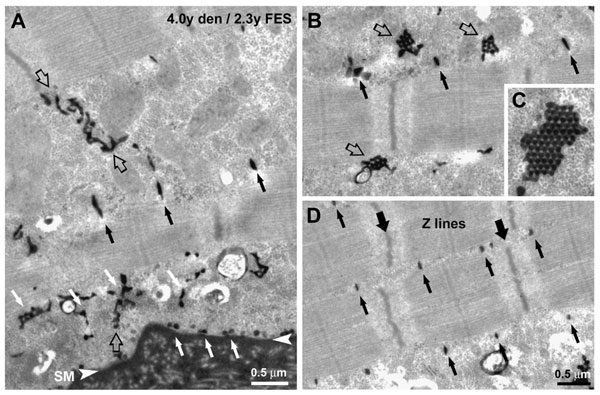
Fig. 7. Formation and maturation of the T tubule network in FES-treated fibers. The development of T tubules involves the formation of multiple clusters of caveolae in the subsarcolemmal area (A; white arrows), that are continuous with tortuous T tubules (A; empty arrows) and labyrinthine structures (B, empty arrows; see also C). The network of maturing tubules becomes progressively transversal and positioned at the edges of the sarcomere A band (A-D, small black arrows).

Fig. 8. Muscle force production under electrical stimulation was enough to allow patients to stand up assisted by the FES device. In our patients, muscle groups were stimulated on the average five times a week. The FES-training regime initially elicits only small twitches, but within a few months of training, the patients begin to have tetanic contractions (see SI Movie 1). With years of training, muscle force production of lower extremities under electrical stimulation was restored sufficiently to allow for supported (between parallel bars) standing up, standing, and even for taking of few steps (see SI Movie 2). At the time of biopsy, the patients were able to perform different levels of training exercises between parallel bars assisted by the FES device:
Patient FES 1. Standing up exercise (5 to 10 times x 3).
Patient FES 2. Tetanic contractions, leg extension in sitting position (5 to 10 times x 3).
Patients FES 3 and 4. Stepping in place exercise: standing up and switching on-off left and right legs (5 to 10 times x 3).
Patient FES 5. Walking exercise: 50 footsteps back and forth per session.
Movie 1. FES-assisted exercises in the first periods of training (3 to 6 months). Single twitches in response to single pulses, and tetanic contractions in response to trains of electrical impulses (first patient); and leg extension in sitting position with weights applied to the lower extremity (second patient).
Movie 2. FES assisted exercises in more advanced periods of training (after one year). Leg extension in sitting position switching on and off left and right legs and standing up exercises (first patient); standing up exercise, stepping in place exercise switching on and off left and right legs and FES assisted walking between parallel bars (second patient). The beneficial effect of the FES training extends to blood circulation, skin, and bone density, which show a significant improvement (results from these studies should be collected for publication). Moreover, all of the patients reported a beneficial psychological effect of being able to stand even for few seconds under stimulation.
Table 3. Z-line width measurement*
FES 1 | FES 2 | FES 3 | FES 4 | FES 5 | Control | |
Fiber 1 | 65 ± 3 | 66 ± 4 | 70 ± 6 | 69 ± 5 | 71 ± 4 | 75 ± 5 |
Fiber 2 | 66 ± 5 | 71 ± 4 | 73 ± 4 | 73 ± 7 | 75 ± 8 | 76 ± 4 |
Fiber 3 | 69 ± 4 | 73 ± 4 | 73 ± 5 | 84 ± 8 | 77 ± 6 | 85 ± 5 |
Fiber 4 | 69 ± 5 | 75 ± 7 | 74 ± 6 | 89 ± 6 | 86 ± 5 | 96 ± 4 |
Fiber 5 | 72 ± 4 | 75 ± 4 | 86 ± 5 | 92 ± 9 | 91 ± 4 | 97 ± 3 |
Average | 70 ± 5 | 71 ± 6 | 76 ± 8 | 81 ± 11 | 80 ± 10 | 86 ± 11 |
*All values are shown as means ± SD.
Measurement of the average Z line width indicates that, in patients that were stimulated for shorter periods (FES 1 and 2), most fibers have thinner Z lines (presumably fibers of a faster type), whereas in patients that trained for longer periods (FES 3-5), fibers presenting wider Z lines are also present (presumably fibers of a slower type). The average Z line width (bottom row) increases from patient FES 1 to patients FES 4-5, becoming progressively closer to that of the control sample (male, 28 years of age). The statistical analysis indicates that the difference in average Z line width between patients FES 1-2 and FES 4-5 is significant (Student's t test: P < 0.001).