[View Larger Version of this Image]
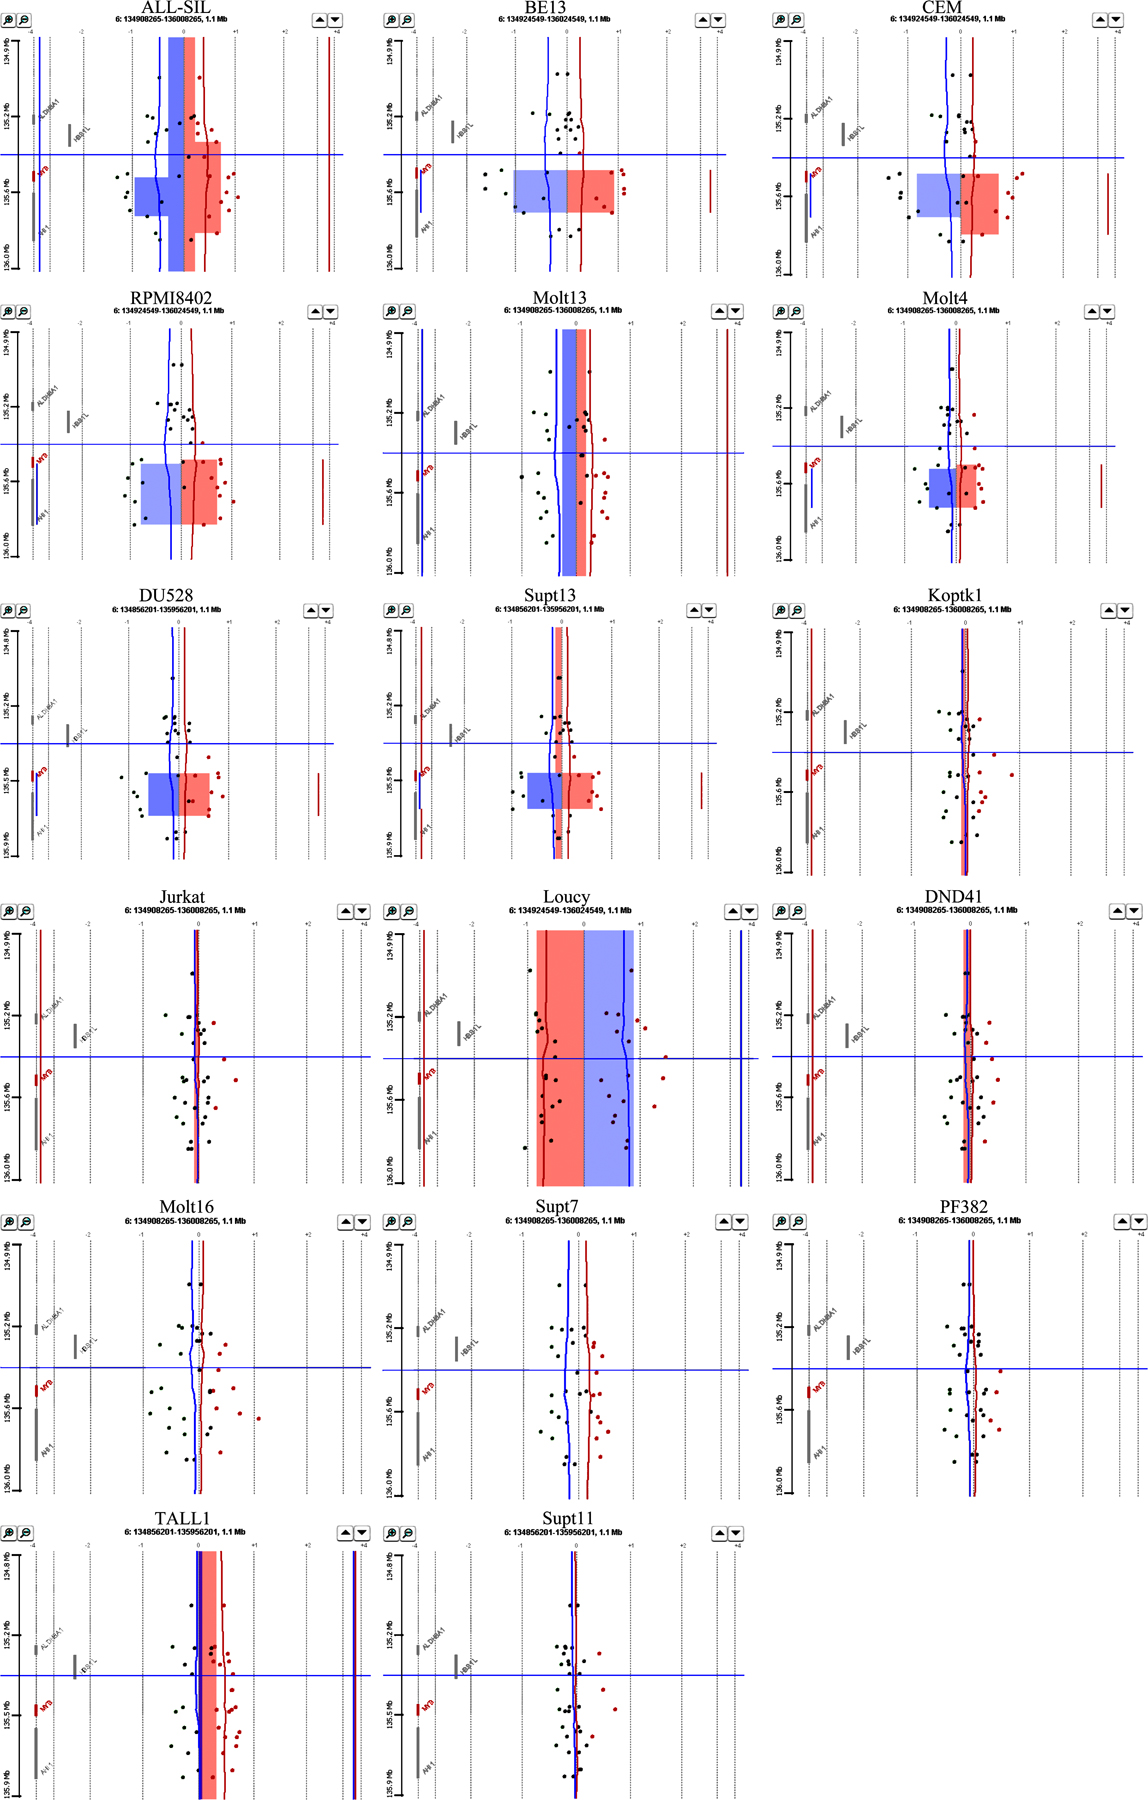
Figure S1. Array CGH data on the 17 T-ALL cell lines around the MYB gene analyzed by CGH Analytics software (Agilent Technologies). Red line indicates the average log2 ratio of Cy5-labeled cell line DNA over Cy3-labeled control DNA. The blue line indicates the dye-swap experiment for which the cell line DNA is labeled with Cy3 and the control DNA with Cy5. Each dot represents the fluorescence for an individual probe; red dots represent probes for which the intensity in the Cy5 channel is larger than for the control sample, and green dots represent probes for which the intensity in the Cy3 channel is larger than for the control sample. The genes on 6q23 and their genomic locations relative to the probes are shown on the left side of each plot. The shaded region depicts the region that is amplified (or deleted).