[View Larger Version of this Image]
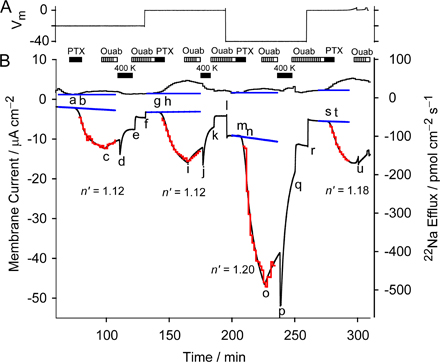
Figure S2. Data at three holding potentials in a single axon. In this experiment, similar to that of Fig. 7, it was possible to obtain four estimates of n’ in an axon held successively at -20, 0, -40, and then again at 0 mV. The four estimated values of n’ at these holding potentials were 1.12, 1.12, 1.20, and 1.18, respectively. The axon was bathed in 400 mM Na+, K+-free solution; PTX (5 nM) and ouabain (100 µM) were added as indicated. The recovery from PTX exposure was sped up by replacement of 400 mM Na+ with 400 mM K+ as indicated. The red and blue lines have the same meaning as in the other figures, and are discussed in the text.