[View Larger Version of this Image]
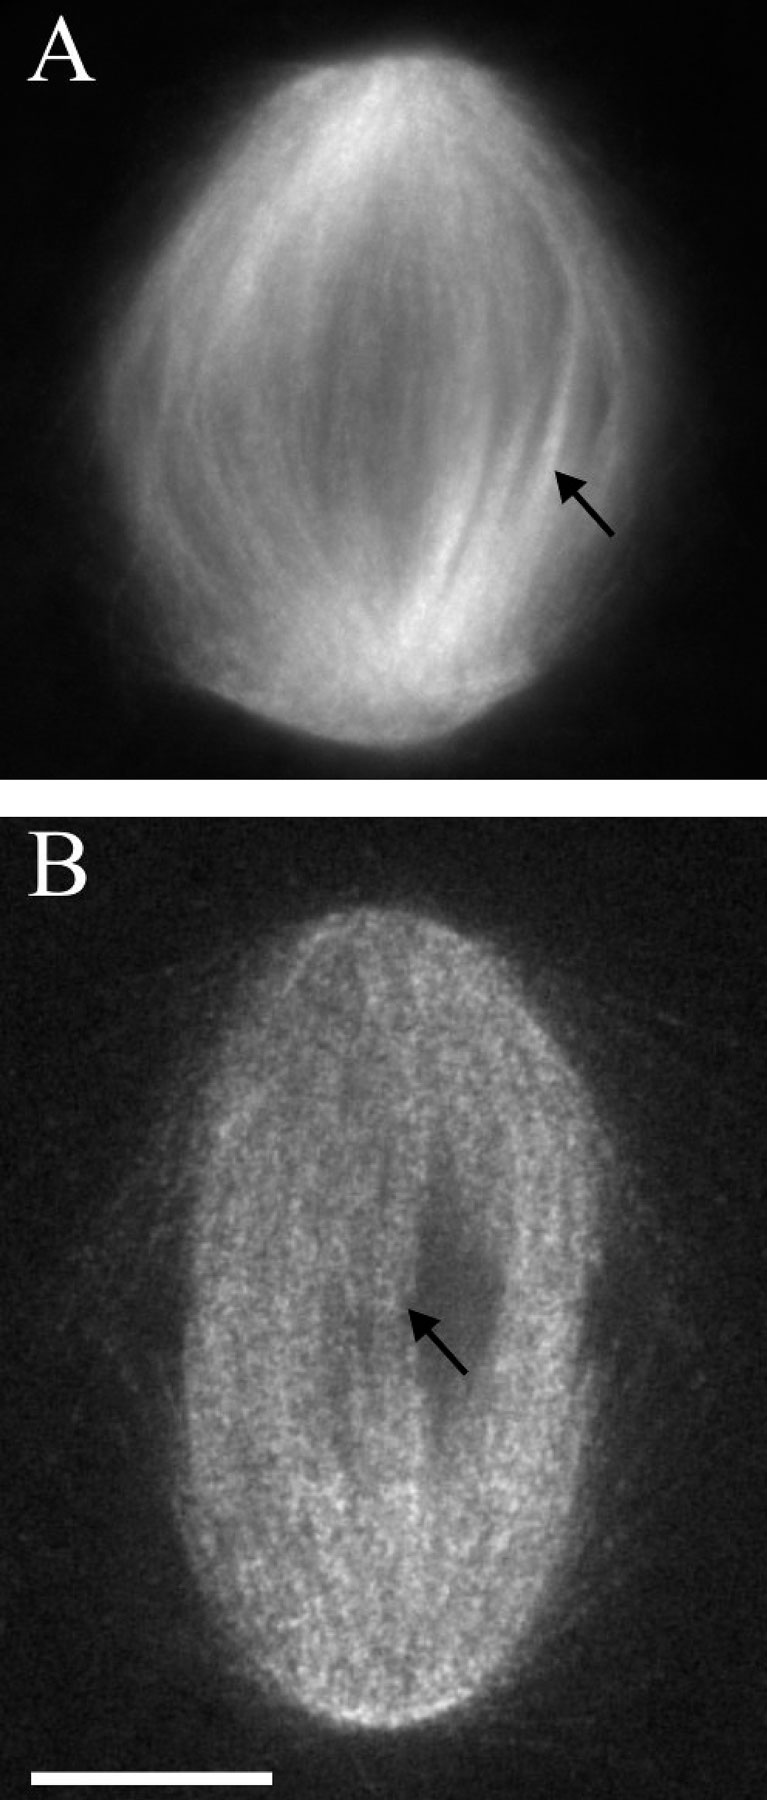
Figure S1. Comparison of a widefield fluorescence image of a spindle (A) to a spinning-disk confocal fluorescent image of another spindle (B) in the same extract. The extract contained a high concentration of fluorescent tubulin ( 1 µM, 1-2% of total tubulin) for detection of kinetochore and interpolar spindle fibers and fluorescent speckles (see Materials and methods). Arrows mark bundles of microtubules that could be either kinetochore fibers or interpolar spindle fibers. Bars, 10 µm.