[View Larger Version of this Image]
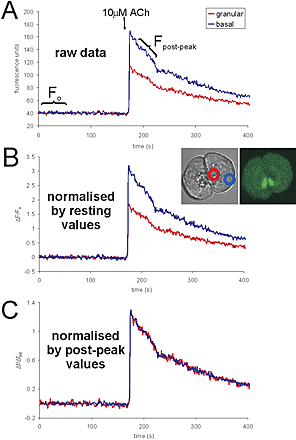
Figure S1. Graphsshowing normalizationtechniquesfor fluo-4 fluorescence.The three tracesshow fluo-4 signalsfrom intracellular regionsof the isolatedpancreatic acinar cell (shownintransmittedimage) during supramaximal stimulation.(A) Raw fluorescence data from granular andbasal regions.Note the resting levelsinboth regionsare similar butlarge differencesbecome manifestedafter stimulation.These differencesare likely due to variationsindye concentrationinthe two regionsbecause the calcium levelsare knownto be equal during the declining phase of such transients(asdeterminedby ratiometric calcium imaging).Differencesindye concentrationmostprobably reflectvariationsinthe volume of cytosol unoccupiedby organelles.(B) Normalizationby resting values(Fo - pointshownintrace A) cannotaccurately accountfor the variationsindye concentration, because the differencesare notmanifestedatresting levelsbecause the fluorescence of fluo-4 isvery low atlow calcium levels.(C) Normalizationby post-peak values(Fpp - pointshownintrace A) whenthe calcium concentrationandfluorescence are elevatedallowsaccurate normalizationof the fluo-4 signal.Fpp ratio = 1.71.