[View Larger Version of this Image]
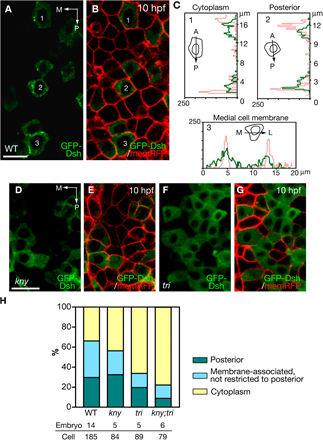
Figure S2. Subcellular localization of GFP-Dsh in the medial PSM at the tailbud stage (10 hpf). (A and B) Confocal images of the medial PSM in a live WT embryo expressing membrane-RFP (memRFP) (red) globally and GFP-Dsh (green) mosaically. Three cells with different GFP-Dsh localizations are selected and the histograms of the fluorescent intensity are shown in C. (C) Green lines represent the fluorescent intensity of GFP-Dsh, and red lines represent the intensity of memRFP. (D–G) GFP-Dsh and memRFP expression in the medial PSM in kny and tri individual mutants. (H) Quantification of GFP-Dsh localization in the medial PSM at the tailbud stage (see Materials and methods). (A, B, and D–G) Dorsal views. Bar, 20 μm. A, anterior; L, lateral; M, medial; P, posterior.