Dulla et al. 10.1073/pnas.0711723105. |

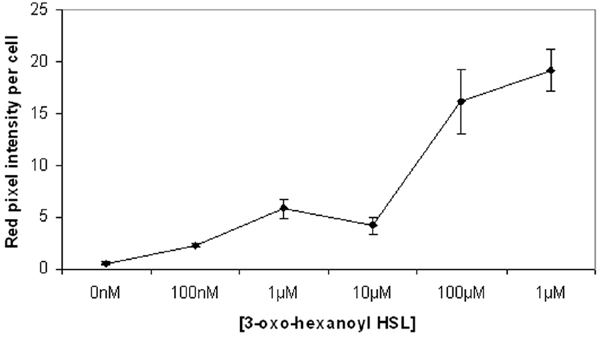
Fig. 3. Cells of Pss (pIRed) exhibited increasing red fluorescence as measured by pixel intensity after 5 h of growth supplemented with increasing concentrations of 3OC6-HSL. Error bars represent one standard deviation; n = 10.

Fig. 4. The distribution of cell aggregate sizes found on wet leaves (A) and dry leaves (B) at different times after inoculation (day 1, turquoise; day 2, yellow; day 3, red; day 4, blue).