
Vermaas et al. 10.1073/pnas.0708090105. |
Fig. 5. Normalized intensities for each pigment component resolved from hyperspectral images obtained from seven Synechocystis strains/conditions. The seven strains/conditions in vertical order in the image are as follows: wild type grown in light (WT LT), wild type grown in light-activated heterotrophic growth (LAHG) conditions (WT LAHG), the ChlL-less strain grown in light (C LT), the ChlL-less strain grown in LAHG conditions (C LAHG), the PS I-less strain grown in light (PSI LT), the ChlL-less/PS I-less strain grown in light (PSI & C LT), and the ChlL-less/PS I-less strain grown in LAHG conditions (PSI & C LAHG). Representative cells were selected from individual images of each strain/condition, and individual cell data were placed into a composite image with one cell type per row. This composite image facilitated the MCR decomposition and component-specific ANOVA calculations performed on the composite image data to determine the relative variance between Synechocystis strains/conditions, between cells of a single strain/condition, and between pixels within cells (see Fig. 4). Spectral components extracted from the composite image correspond to the resolved pure spectral signatures shown in Fig. 1A. Intensities shown have been normalized on a pixel-by-pixel basis such that the total percent contribution (sum of all components) equals 100% for each strain/condition. Color bar shows the percent contribution to total fluorescence intensity. This view highlights several important characteristics of the cells. (i) The relative PC intensity is fairly constant throughout all strains/conditions. (ii) Chl-685 is reduced when cells are grown under LAHG conditions, particularly in the strains lacking ChlL because these are Chl-depleted. (iii) Chl-698 is reduced in strains lacking PS I because long-wavelength Chl is associated with PS I. (iv) There are distinct differences in the spatial arrangement of Chl-685 vs. Chl-698. (v) Carotenoids are concentrated in the cell wall but are also present throughout the cell. (vi) APC-B and/or the terminal fluorescence emitter of the phycobilisome emits more in strains/conditions where Chl is depleted (C LAHG, for example) because light energy cannot be transferred to Chl.
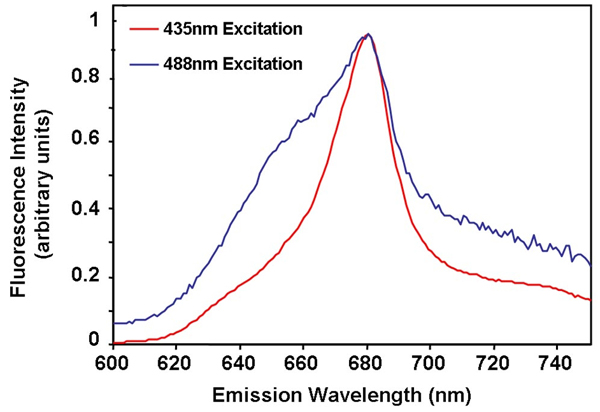
Fig. 6. Normalized emission spectra of wild-type Synechocystis cells acquired on a conventional fluorimeter with 435-nm and 488-nm excitation. The maximum fluorescence intensity upon 435-nm excitation was 9-fold higher than at 488-nm excitation.
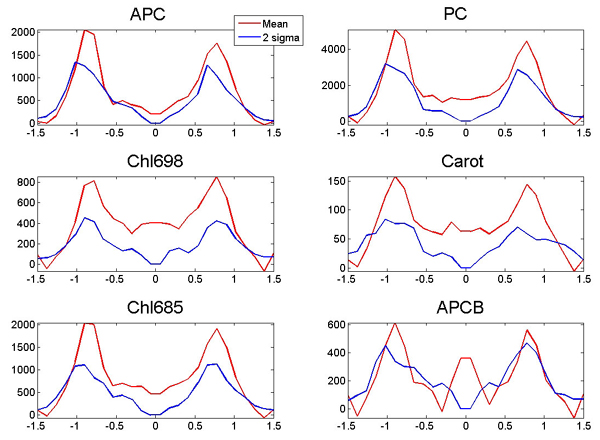
Fig. 7. Significance of the data. Mean normalized composition profiles (red) and corresponding 2 standard deviation levels (blue) obtained from the 10 equally spaced cross-cuts through the wild-type cell (cell presented in Fig. 2) for each of the six emission components. When the red curve exceeds the blue curve in any plot, the mean signals are significant at the a = 0.05 significance level.
Fig. 8. Transmission electron microscope micrographs of Synechocystis strains. Each panel consists of three different thin sections from three different cells. (A) Wild-type Synechocystis cells grown in continuous light. (B) ChlL-less Synechocystis cells grown in continuous light. (C) ChlL-less Synechocystis cells grown under LAHG conditions. (D) PS I-less Synechocystis cells grown in continuous light. T, thylakoid membrane; PM, plasma/cytoplasmic membrane; PG, peptidoglycan layer; OM, outer membrane; S, S-layer; PHB, polyhydroxybutyrate granule; PP, polyphosphate granule. (Scale bars: 200 nm.)

Fig. 9. Mesh plots of relative intensity vs. spatial distribution of the six individual components in a wild-type Synechocystis cell grown in the light (first column), a ChlL-less cell grown in LAHG conditions (second column), and a PS I-less cell grown in the light (third column). Mesh plots indicating the 95% confidence level for the PS I-less cell are in the fourth column. In the fourth column, voxels in green meet the 95% confidence criterion calculated based on the Poisson and read noise of the data (see Materials and Methods) whereas voxels in red do not. x and y axis labels have been removed for simplicity. Each of the representative cells are ~2 mm in diameter. This image is obtained from the same data as shown in Fig. 3 except that relative intensities of the components are presented rather than the percentage that each component contributes to the fluorescence intensity of a particular pixel (Fig. 3). In addition, to enhance visualization, the cells are rotated by 90° relative to the cells in Fig. 3.

Fig. 10. Hyperspectral imaging scans through wild-type Synechocystis cells. To investigate potential self-absorption and scattering behavior of the cells, a composite image was created with each row being assigned image pixels from hyperspectral images of cells in three focus positions: top, middle, and bottom of the cell. The images at each of these positions were taken of different cells to avoid confounding of the results with potential photobleaching effects. The color bar indicates the relative fluorescence intensity. Note that for the more highly scattering (shorter-wavelength) components the images taken at the bottom focus position were less intense than those at the top. This is attributed to scattering rather than self-absorption. No self-absorption occurred because there was no change in the spectral properties of the components of top vs. middle vs. bottom of the cell. (Scale bar: 2.5 mm.)
Table 1. Fluorescence intensity statistics for individual components as determined from MCR analysis of hyperspectral images of various Synechocystis strains that were grown in continuous light (L) or under LAHG conditions (D)
Strain, conditions | % PC | % APC | % APC-B | % Chl (685 nm) | % Chl (698 nm) | % Car | % of WT |
Wild type, L | 41.4 | 20.0 | 4.8 | 26.7 | 6.4 | 0.7 | 100 |
Wild type, D | 37.9 | 26.6 | 8.8 | 20.4 | 5.5 | 0.8 | 106 |
ChlL-less, L | 38.3 | 9.8 | 10.4 | 33.8 | 5.4 | 2.3 | 23.5 |
ChlL-less, D | 41.5 | 24.5 | 13.7 | 17.4 | 2.0 | 0.9 | 24.5 |
PSI-less, L | 37.3 | 32.0 | 6.4 | 22.9 | 1.0 | 0.4 | 84.3 |
PSI-less/ChlL-less, L | 36.5 | 8.1 | 14.8 | 38.5 | 0.5* | 1.7 | 25.4 |
PSI-less/ChlL-less, D | 41.4 | 29.2 | 12.0 | 13.9 | 2.6 | 0.9 | 33.2 |
Percentages reported were calculated by determining the mean fluorescence intensity of each component at its emission maximum from all of the cells in an image of a strain and dividing that value by the sum of the mean values for all components for that strain. All percentages except those indicated by an asterisk are statistically supported. The value in the last column indicates the percentage of total signal relative to the wild-type Synechocystis grown in light. Note: The carotenoid mean intensities were calculated by using the baseline-corrected intensity at the most intense Raman peak, rather than at the emission maximum as done for the fluorescence emission components.