[View Larger Version of this Image]
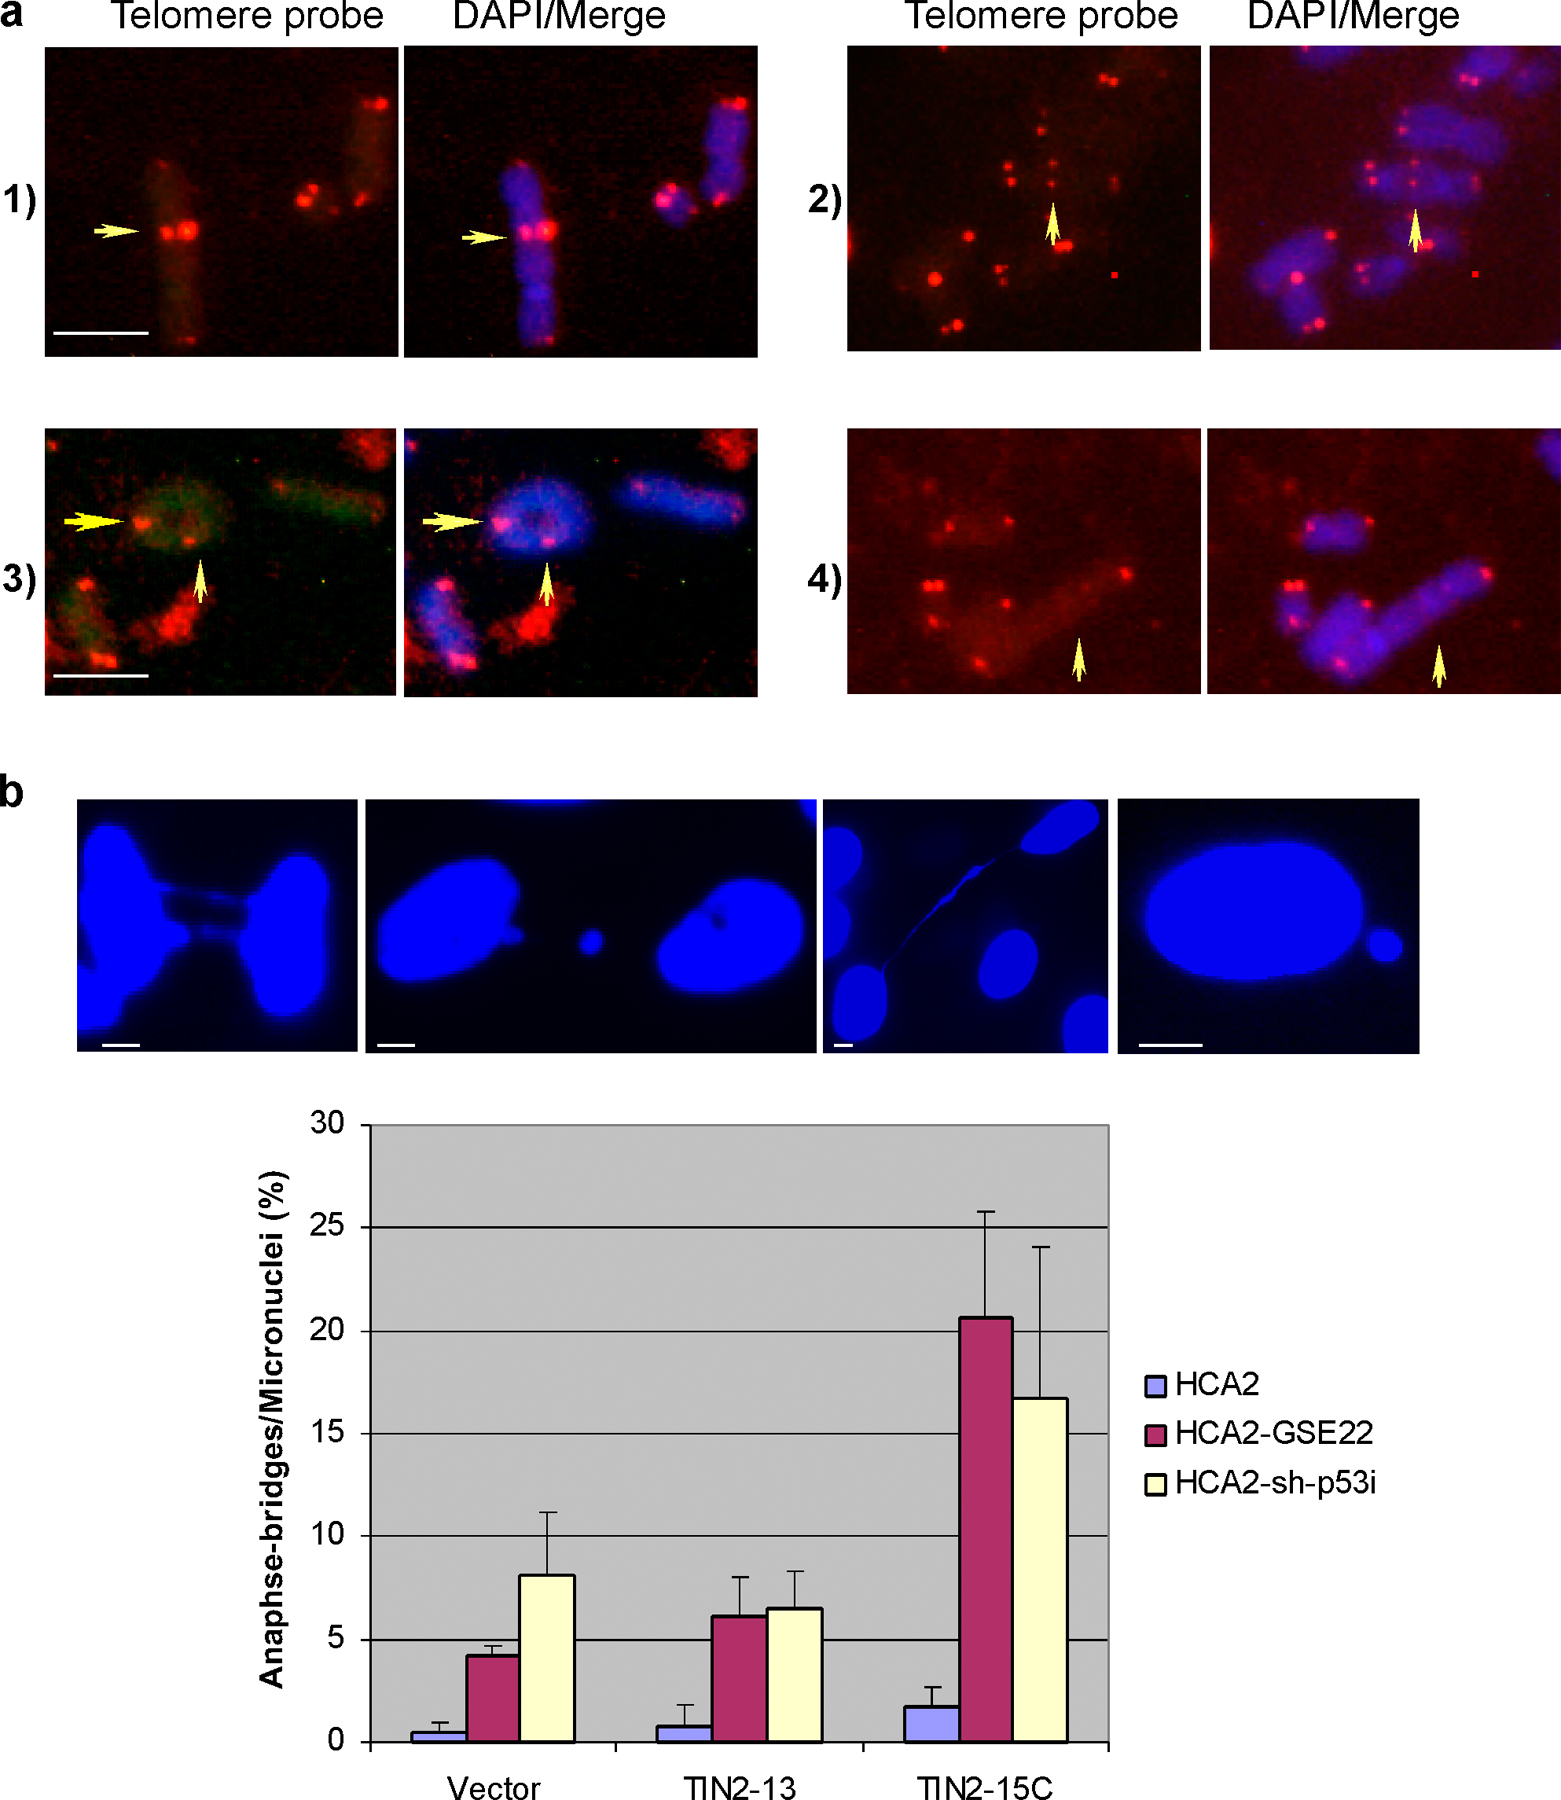
Figure S5. Telomeric fusions and anaphase bridges in cells expressing TIN2-15C. (a) Telomeres were visualized by FISH on metaphase spreads using a telomeric PNA probe. Telomere fusions as indicated by the yellow arrow were detected by superimposing the telomere image on the DAPI-stained chromosome image. Examples are shown of chromosome fusions with (1, 2, and 3) or without (4) telomeric DNA at the sites of fusion, and a circular fusion (3). Bars, ∼1 µM. (b) As shown for the cell death analyses in Fig. 4 a, presenescent HCA2 cells were first infected with a retrovirus expressing GSE-22 or a lentivirus expressing sh-p53 and then infected with lentiviruses expressing GFP, TIN2-13, or TIN2-15C. Cells were treated with the caspase inhibitor (QVD) as described previously (Goldstein, J.C., F. Rodier, J.C. Garbe, M.R. Stampfer, and J. Campisi. 2005. Aging Cell. 4:217–222). Anaphase bridges and micronuclei were quantified after DAPI staining. ∼200 cells were scored in two or three independent experiments for each transfection. Error bars represent the standard deviation. Bars, ∼3 µM.