[View Larger Version of this Image]
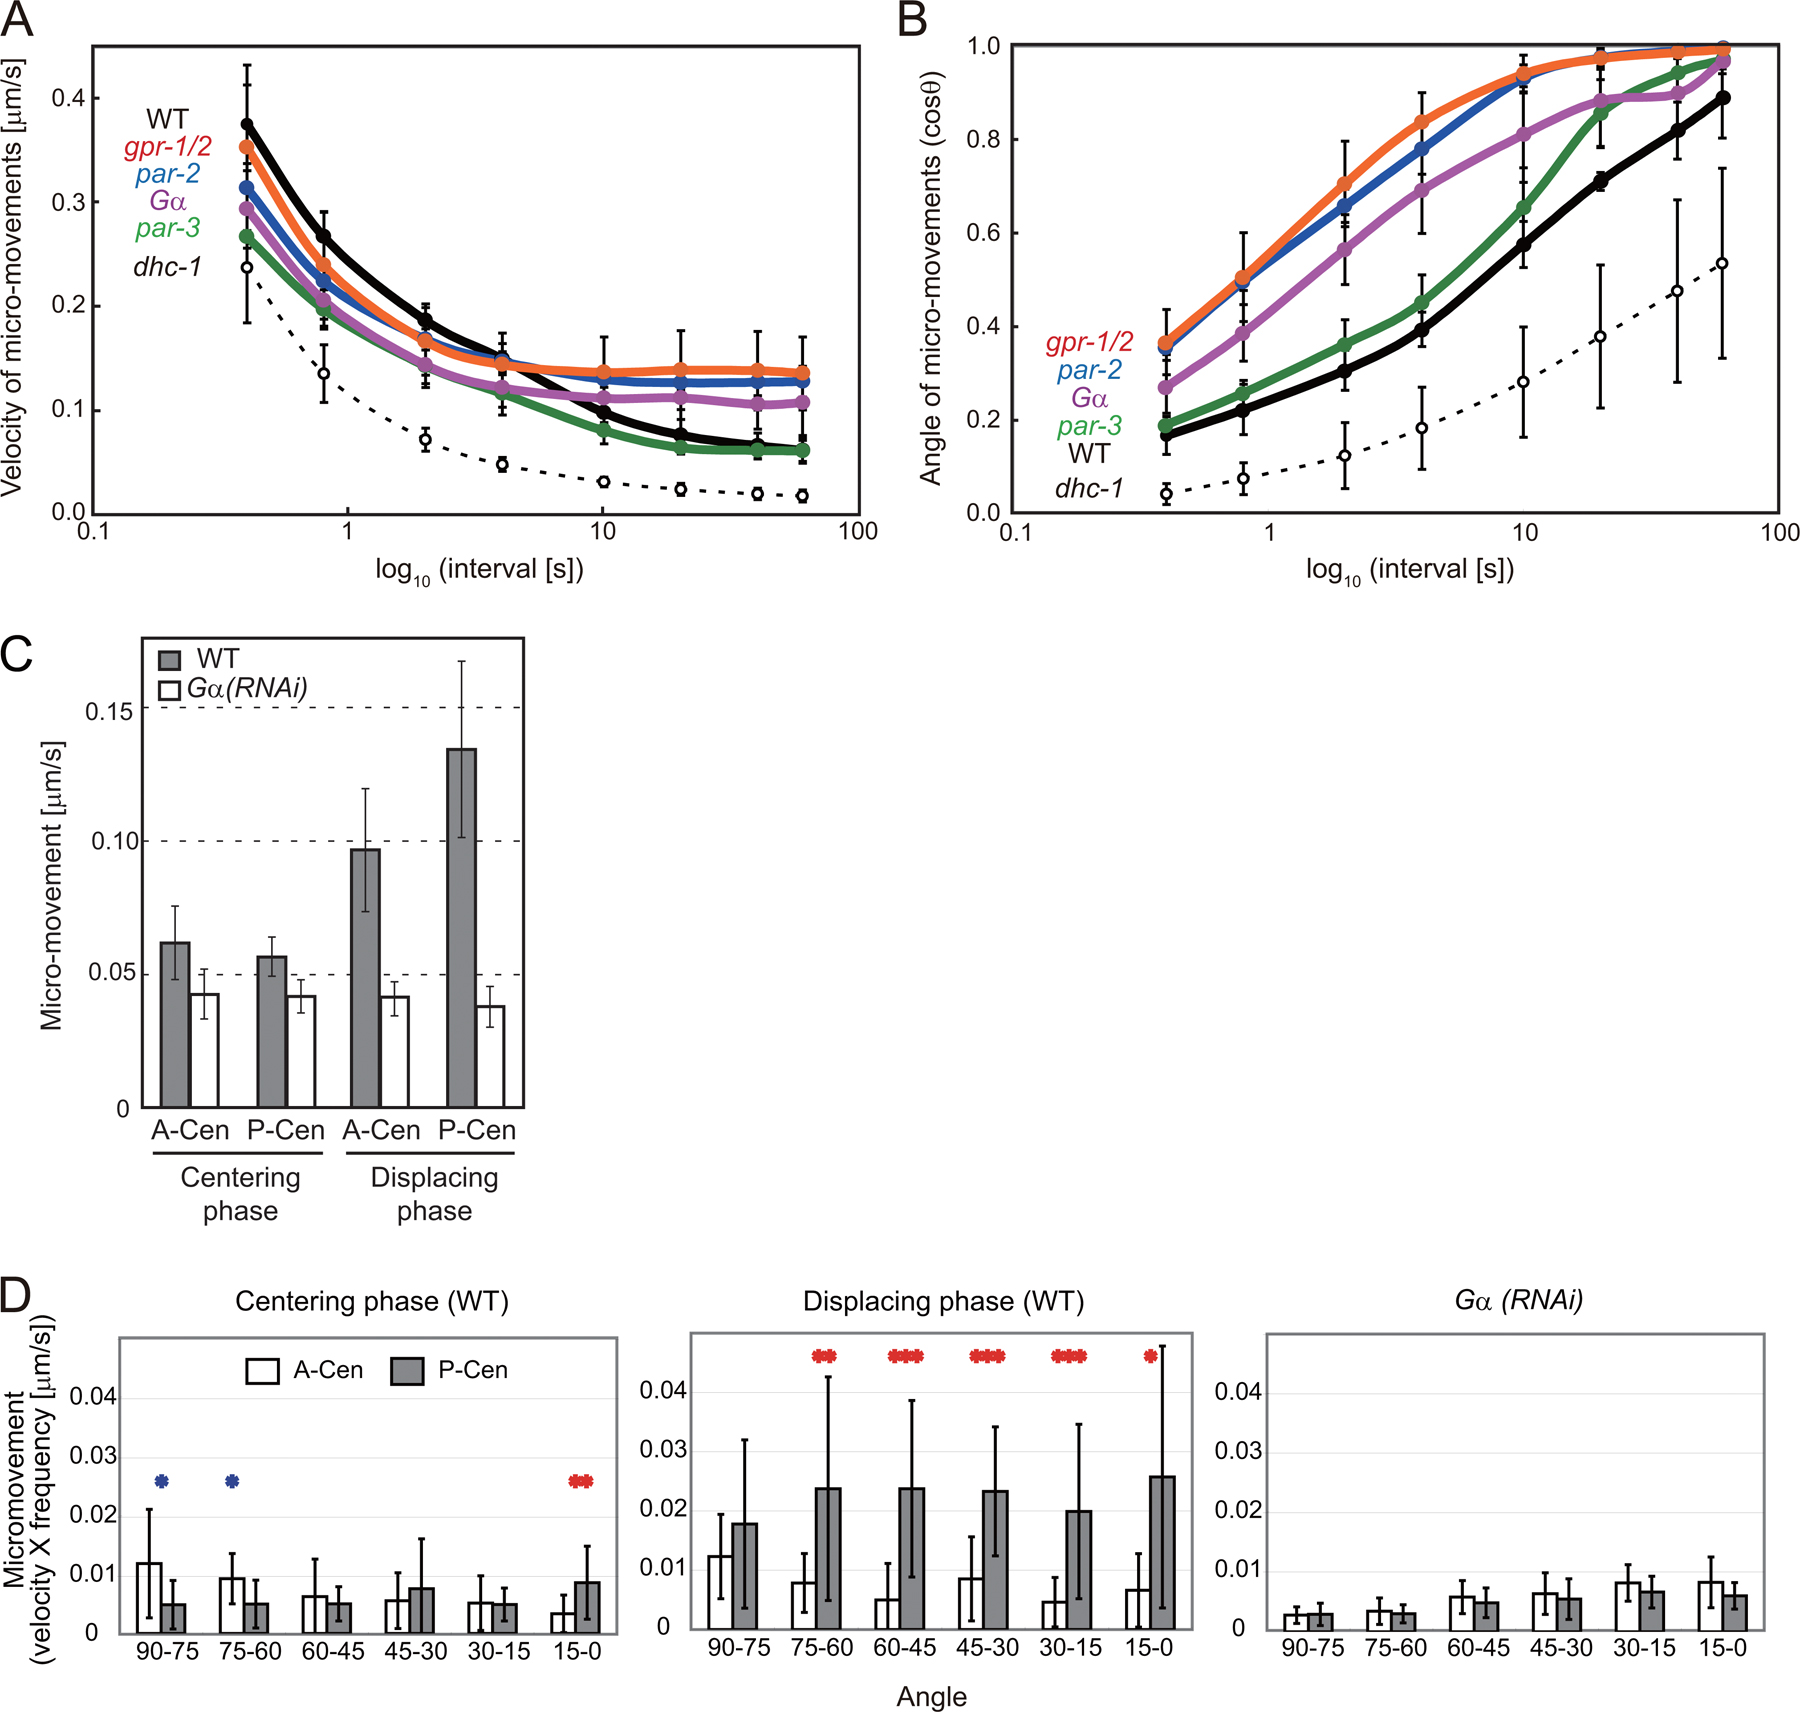
Figure S1. Characterization of micromovements. (A and B) Interval dependency of micromovements of the nuclear–centrosome complex during the establishment stage of centering. The velocity (A) and angle (B) of the micromovements were calculated (Fig. 1, G and F, respectively). With shorter intervals (<10 s), the angles but not the velocities of the micromovements vary among strains. When the intervals become larger (>10 s), the cosines of the angles converge to 1.0, and the velocities converge to the overall velocities of pronuclear migration (Fig. 1 C). (C) Gα dependency of the micromovement of centrosomes during the centering phase (maintenance stage) and displacing phase. The mean velocity of the micromovements of the centrosomes was quantified and compared between wild-type (WT) and Gα(RNAi) embryos (n = 13 for WT and n = 15 for Gα(RNAi)). For Gα(RNAi), centering phase and displacing phase correspond to the first half and the latter half, respectively, of the period from NEBD to the onset of anaphase because displacing migration of the centrosomes is not observed in Gα(RNAi). In all comparisons, micromovements in the WT embryos are significantly larger than those in the Gα(RNAi) embryos (P < 10−6). There is a quantitative difference between the magnitude of the micromovements and that of the movements of optically induced centrosome disintegration aster fragments in a previous study (Grill, S.W., J. Howard, E. Schaffer, E.H. Stelzer, and A.A. Hyman. 2003. Science. 301:518–521). The difference is likely caused by two major differences in the experimental conditions. The first difference is in the assay system. The optically induced centrosome disintegration fragments can move relatively freely because the meshwork of MTs is destroyed by the ablation, whereas the MTs are intact in micromovement analysis. The second difference is in the cell cycle phase when the measurements were performed. The centrosome disintegration experiment was performed in anaphase, when centrosome oscillation is prominent, whereas the micromovement analysis (displacing phase) was performed in metaphase, when displacement along the AP axis occurs but there is little oscillation. See the legend to Fig. 2 for the terms used in the figure. (D) Nonnormalized data from Fig. 2 C. The mean velocity of the micromovements in each angle class was scaled with the frequency with which the micromovements were classified in that class. Asterisks indicate significant differences between the micromovements of the posterior centrosome (P-Cen) and those of the anterior centrosome (A-Cen): *, P < 0.05; **, P < 0.01, ***, P < 0.001. Blue asterisks indicate that the micromovements of A-Cen were significantly larger, whereas red asterisks indicate that those of P-Cen were significantly larger. Error bars represent SD.