[View Larger Version of this Image]
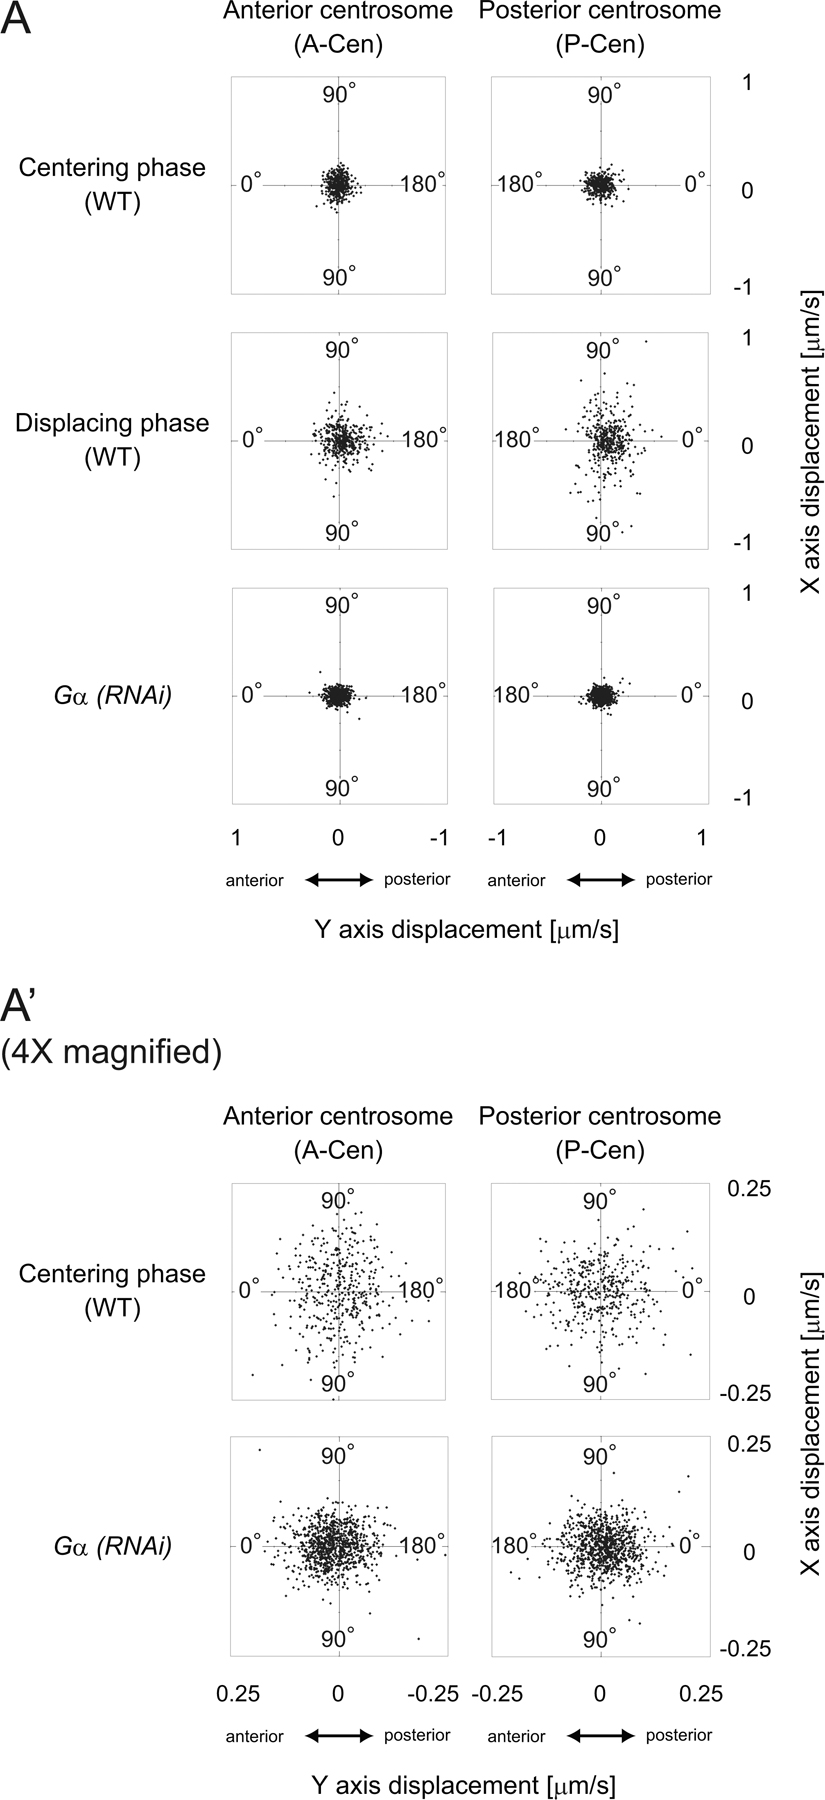
Figure S2. Distribution of the micromovements of centrosomes after NEBD during centering phase (maintenance stage) and displacing phase. Endpoints of the micromovement vectors in Fig. 2 were plotted as shown in Fig. 1 E. The x and y axes are as indicated in Fig. 2 B. (A′) Magnified image of the plot in A. The results from these data are summarized in Figs. 2 and S1 (C and D).