[View Larger Version of this Image]
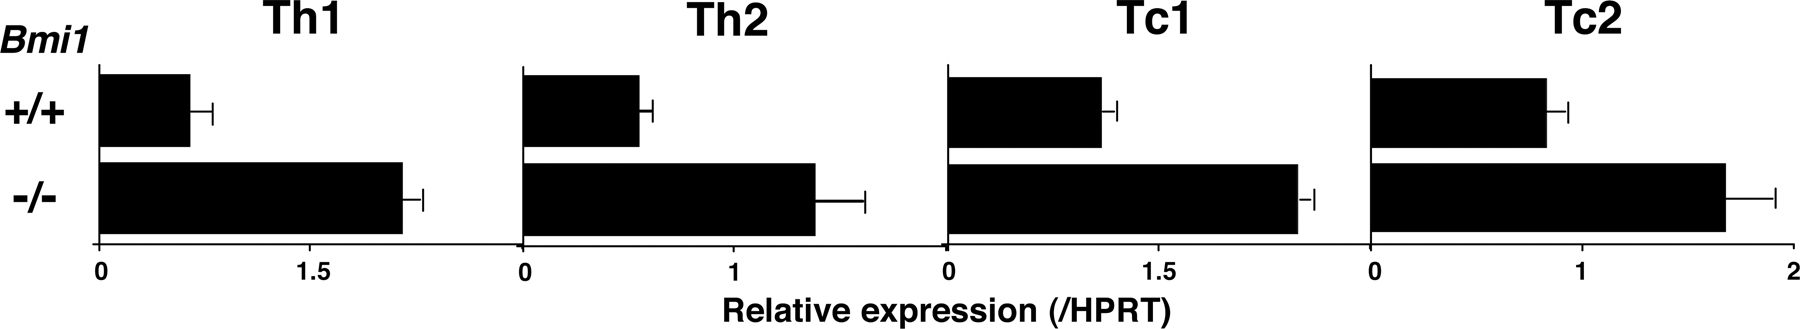
Figure S7. mRNA expression of Noxa in Bmi1+/+ and Bmi1−/− effector Th1, Th2, Tc1, and Tc2 cells was determined by a quantitative RT-PCR system. The relative intensity (/HPRT) (mean of three samples) is shown with standard deviations (n = 3).