Blood, Vol. 111, Issue 12, 5654-5662, June 15, 2008
Discovery of agents that eradicate leukemia stem cells using an in silico screen of public gene expression data
Blood Hassane et al. 111: 5654
Supplemental materials for: Hassane et al
Seeking topoisomerase I inhibitors related to camptothecin (Tables S5 and S6)
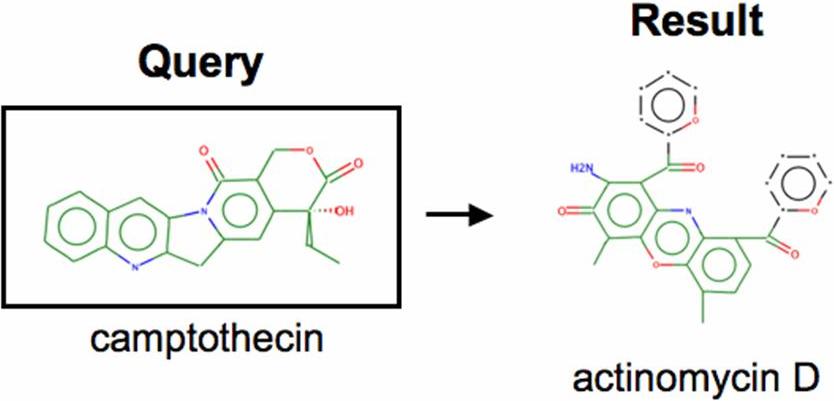
We obtained a signature for exposure of Hela cells to the well-known topoisomerase I inhibitor, camptothecin, from an independent dataset (GEO #GDS885).1 A search of GEO using this signature readily identified gene expression profiles of actinomycin D treatment of HT1080 fibrosarcoma cells (Table S4). Actinomycin D is reported to possess the camptothecin-like ability to stabilize the covalent interaction of topoisomerase I to DNA2 as well as the camptothecin-like ability to inhibit transcription. The effects of camptothecin on transcription are primarily at the level of elongation.3 The discovery of this relationship further suggests the utility of the current approach. Subsequent GEO profiles scoring lower than actinomycin D included experiments involving metabolic arrest as a consequence of various physiological perturbations, which may be informative as a possible downstream consequence of camptothecin exposure. Though we expected to discover additional well-known topoisomerase I inhibitors such as topotecan, a text search of GEO for such treatments revealed no such experiments in the U133-based platforms employed in these studies. The expression profile of actinomycin D is reportedly distinct from other DNA metabolic poisons such as the topoisomerase II inhibitor, doxorubicin,4 which was not a top hit for the camptothecin query. In addition, as shown for PTL in the main text, when untreated Hela controls from the experiment above were used to search GEO, other GEO expression profiles of Hela cells were identified (Table S5), thereby further validating the search stategy.
Methods
To search for camptothecin-like biological states, the independent dataset GDS885 was obtained from GEO using the GEOquery BioConductor package. The expression profile was subset to the same 22,215 probesets as the PTL signature. However, because the sample size for this experiment is very small (3 replicates per condition), the standard error estimate of the t-statistic was moderated according to the published Cyber-T method.5,6 The 150 probesets demonstrating the most statistically significant differential expression were taken as the signature, mean ranks were computed for the camptothecin-treated and untreated (Hela cells) group. All probesets used in the query signature were below the p
Files in this Data Supplement:
- Table S1. Differentially expressed genes in the PTL vs. untreated comparison in 12 patient pairs (p
- Table S2. Categorical analysis of differentially expressed genes (PDF, 42 KB)
- Table S3. Query signature for identifying PTL-like biological states in GEO (PDF, 59.2 KB) -
Gene expression data was converted from real numbers to ranks. The mean rank for the PTL group and untreated group are shown for the 150 gene signature used to query GEO. - Table S4. Top 15 GEO entries similar to untreated CD34+ AML as determined by V-score (PDF, 21.7 KB)
- Table S5. Top 15 V-score results querying for camptothecin-like GEO entries (PDF, 21.6 KB)
- Table S6. Top 15 V-score results querying untreated Hela-like GEO entries (PDF, 21.6 KB)
- Table S7. Top 15 results upon querying connectivity map (PDF, 26.7 KB)
- Table S8. Common probesets among Affymetrix U133-based microarrays (AFFX probes excluded) (CSV, 258 KB)
- Figure S1. Comparison of sensitivity of AML compartments to treatment with 2 µM celastrol (JPG, 50.3 KB) -
Percent viability relative to untreated controls for total (white bars), CD34+CD38− (gray), and CD34+ (shaded) AML populations are shown +/− s.e.m. Significant loss of viability occurs in all compartments following celastrol treatment (single asterisk, p
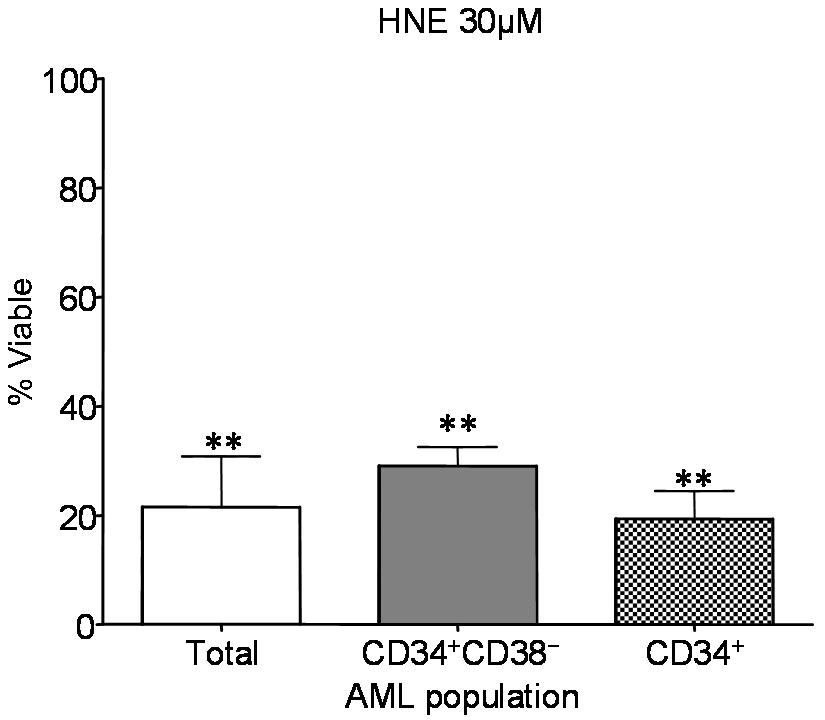
- Figure S2. Comparison of sensitivity of AML compartments to treatment with 30 µM HNE (JPG, 42.2 KB) -
Percent viability relative to untreated controls for total (white bars), CD34+CD38− (gray), and CD34+ (shaded) AML populations are shown +/− s.e.m. Significant loss of viability occurs in all compartments following HNE treatment (double asterisk, p
- Figure S3. The 150 query signature genes distinguish PTL vs. untreated AML cells (JPG, 100 KB) -
Average linkage hierarchical clustering is shown using Pearson correlation as the dissimilarity metric for the 24 microarrays employed to derive the PTL gene expression signature in these studies. Expression values are row normalized. Samples form two main clusters, the PTL and untreated groups.
- Figure S4. Immunoblot of phospho-p65 and heme oxygenase I in FACS-purified CD34+CD38− AML (JPG, 29 KB) -
Exposure of primary CD34+CD38− AML cells is shown for untreated cells alongside 2 µM celastrol, 30 µM 4-hyrdroxynonenal (HNE), and 7.5 µM parthenolide (PTL) at 6 h post-treatment. Levels of phospho-p65, heme oxygenase I (HO-1), and -actin are shown.
- Figure S5. Dose response to celastrol and 4-hydroxynonenal compared to parthenolide (JPG, 64.3 KB) -
(A) Thiol content is measured by mBBr fluorescence at increasing doses of celastrol, 4-hydroxynonenal (HNE), and parthenolide (PTL) at 6 h post-treatment. The vertical axis indicates fold change relative to untreated controls. (B) Immunoblot of phospho-p65 at increasing doses of celastrol, HNE, and PTL is shown at 6 h post-treatment. (C) Percent viability is shown relative to untreated controls for increasing concentrations of celastrol, HNE , and PTL at 24 h post-treatment. The same representative primary CD34+ AML patient sample is shown in panels A-C.
- Figure S6. Schematic of gating for FACS analysis of viability in CD34+ and CD34+CD38− cells (JPG, 80.6 KB) -
Representative gating scheme is shown. Total viability was assessed by placing quadrants for Annexin V vs 7-AAD populations. Where the percent viable cells was determined by the Annexin V negative/7-AAD negative quadrant. To determine the percent viability of CD34+ and CD34+CD38− cells, a gate on the main population was first placed to minimize the background fluorescence from non-intact cells, subsequently a second gate was drawn for CD34+ and CD34+CD38− populations. Finally the same quadrants placed for the total population (Annexin V vs 7-AAD) were used to determine the percent viability on each of the gated populations.
- Figure S7. Chemical structures of camptothecin and actinomycin D (JPG, 27.6 KB) -
A camptothecin-derived gene expression signature (topoisomerase I inhibitor) identifies an additional topoisomerase I inhibitor, actinomycin D.
REFERENCES
1. Carson JP, Zhang N, Frampton GM, Gerry NP, Lenburg ME, Christman MF. Pharmacogenomic identification of targets for adjuvant therapy with the topoisomerase poison camptothecin. Cancer Res. 2004;64:2096-2104.
2. Trask DK, Muller MT. Stabilization of type I topoisomerase-DNA covalent complexes by actinomycin D. Proc Natl Acad Sci U S A. 1988;85:1417-1421.
3. Bendixen C, Thomsen B, Alsner J, Westergaard O. Camptothecin-stabilized topoisomerase I-DNA adducts cause premature termination of transcription. Biochemistry. 1990;29:5613-5619.
4. Lehnhardt M, Klein-Hitpass L, Kuhnen C, et al. Response rate of fibrosarcoma cells to cytotoxic drugs on the expression level correlates to the therapeutic response rate of fibrosarcomas and is mediated by regulation of apoptotic pathways. BMC Cancer. 2005;5:74.
5. Baldi P, Hatfield GW. DNA Microarrays and Gene Expression. Cambridge University Press 2002.
6. Baldi P, Long AD. A Bayesian framework for the analysis of microarray expression data: regularized t -test and statistical inferences of gene changes. Bioinformatics. 2001;17:509-519.