Blood, Vol. 111, Issue 12, 5712-5720, June 15, 2008
Structural and functional effects of hereditary hemolytic anemia-associated point mutations in the alpha spectrin tetramer site
Blood Gaetani et al. 111: 5712
Supplemental materials for: Gaetani et al
Files in this Data Supplement:
- Figure S1. CD spectra of wild type and mutant α0-1 spectrin peptides (JPG, 74.4 KB) -
Samples were analyzed in phosphate buffered saline, pH 7.4 at room temperature. The spectrum of the wild type 0-1 recombinant is repeated in each panel for comparison.
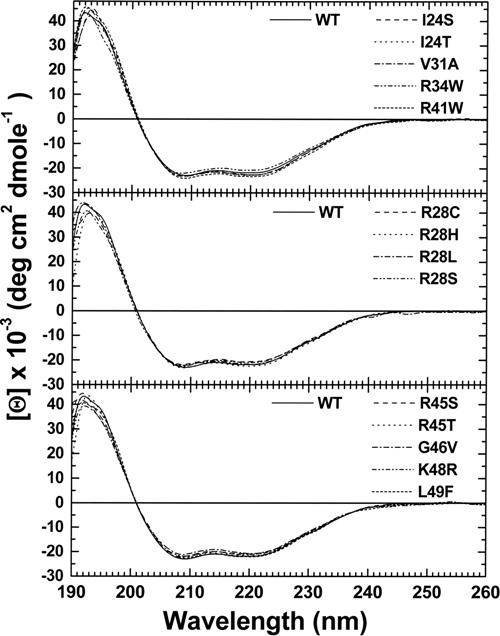
- Figure S2. Sedimentation equilibrium analysis of α0-1 spectrin peptides (JPG, 87.1 KB) -
Representative data from sedimentation equilibrium analyses of recombinant proteins in 20 mM Tris, 130 mM NaCl, 1 mM EDTA, 0.1 mM PMSF and 1 mM TCEP, pH 7.4, at 28,000 rpm and 4°C are shown. (A)0-1 wild type recombinant protein with three initial loading concentrations of 1.5, 0.75 and 0.375 mg/ml. (B) the I24S 0-1 recombinant protein is shown as a representative case (all other mutants produced comparable results) with three initial loading concentrations of 1.0, 0. 5 and 0.275 mg/ml. Lower panels – Raw data are shown using circles and global fits for a monomer species are indicated by lines, although these lines are obscured by the data symbols. Upper panels – The residuals of the fitted curves to the data points are represented for each concentration from the highest to the lowest, from top to bottom respectively.
- Figure S3. Representative tetramer site gel filtration assays (JPG, 55.7 KB) -
Preliminary time course experiments were conducted using wild type0-1 and  16-17, which verified equilibrium was reached within 1 hr at 37°C. For subsequent experiments 500 pmoles 0-1 (wild type or mutant) and 500 pmoles 16-17 were mixed, incubated 1 hr at 37°C, and immediately injected onto a TSKgel Super SW3000 (4.6 mm I.D. × 30 cm length, Tosoh Bioscience) column equilibrated with 10 mM sodium phosphate, 130 mM NaCl, 1 mM EDTA, 0.15 mM PMSF, 1 mM -ME, pH 7.4. Peaks were eluted at 0.1 ml/min with detection of absorbance at 280 nm. The 0-1/16-17 protein complexes eluted at approximately 35 min, while unbound recombinant proteins eluted at approximately 40 min. Top panel, binding assay of 0-1 K48R + 16-17 ( ____ ), 0-1 K48R only (...), 16-17 only ( --- ); binding affinity in this case is similar to wild type (data not shown). Center panel, binding assay of 0-1 G46V + 16-17 ( ____ ), 0-1 G46V alone ( ... ), 16-17 alone ( --- ); binding affinity in this case is substantially weaker than wild type as indicated by reduced amount of complex and increased amount of individual components. Bottom panel, binding assay of 0-1 R28H +16-17 ( ____ ), 0-1 R28H alone ( ... ), 16-17 alone ( --- ); there was no detectable binding in this case as no complex was detected.