
FIGURE 2.
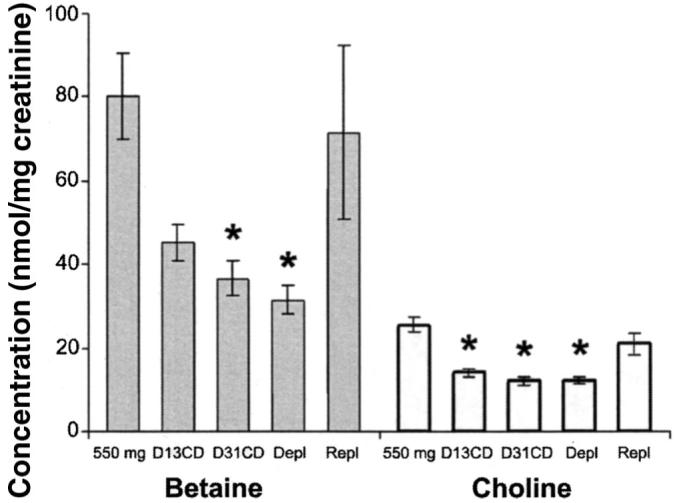
Mean (±SE) urinary betaine and choline concentrations (n = 32–45/time point), from which dietary compliance was assessed. Subjects were treated as described in the legend for Figure 1. Urine samples (24-h) were collected at the end of the baseline (550 mg), depletion (Depl), and repletion (Repl) phases and on days 13 and 31 of the choline-deficient diet (D13CD and D31CD, respectively), and aliquots were analyzed for betaine ( ) and choline (□) concentrations nmol/mg creatinine as described in Methods. *Significantly different from baseline, P < 0.01 (one-factor ANOVA and Dunnett's test).