[View Larger Version of this Image]
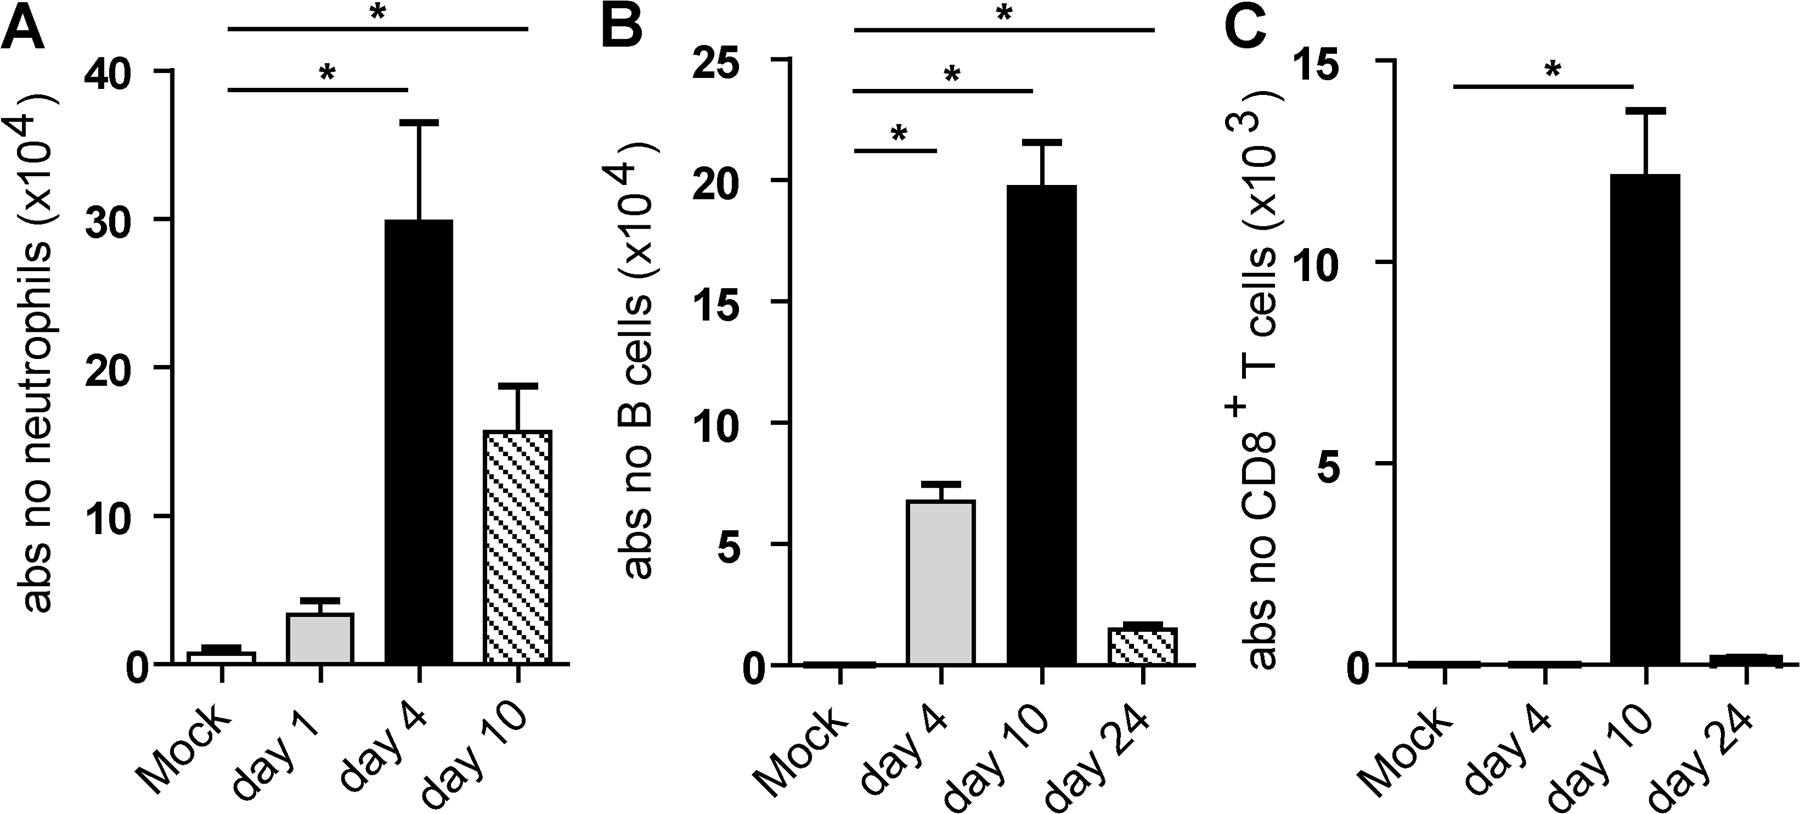
Figure S1. Cellular composition of BAL fluid. (A) Number of CD11b+ Gr1+ neutrophils. (B) Number of CD19+ B cells. (C) Number of CD8+ T cells. The values are representative of five mice per group and are expressed as mean ± SEM. Similar results were obtained from several separate experiments. *, P < 0.05.