Blood, Vol. 112, Issue 3, 886-890, August 1, 2008
Attenuation of EPO-dependent erythroblast formation by death-associated protein kinase-2
Blood Fang et al. 112: 886
Supplemental materials for: Fang et al
Files in this Data Supplement:
- Figure S1. Isolation and purity of stage-I, II and III erythroblasts, and initial assessment of stage-to-stage array data sets (JPG, 175 KB) -
(A) Purity and stagedness were assessed by flow cytometric analyses of EE-positive cells, and by morphologies of cytospin preparations. (B) Stage-to-stage erythroblast gene modulation events — Transcripts expressed in stage I-III erythroblasts (as analyzed using Affymetrix MG-U74Av2 arrays) were compared based on differences in expression intensities from a central no-modulation regression trendline. Lines flanking this centerline mark two-fold increases (up) or decreases (down) in expression. For each stage-wise comparison, numbers of genes with ≥ 2-fold modulated expression also are indexed. In all panels, axes are natural log scales (left panels). Also illustrated are limited differences between duplicate hybridizations for stage I, II and III. "Nd" (number detected) indexes numbers of expressed genes (right panels).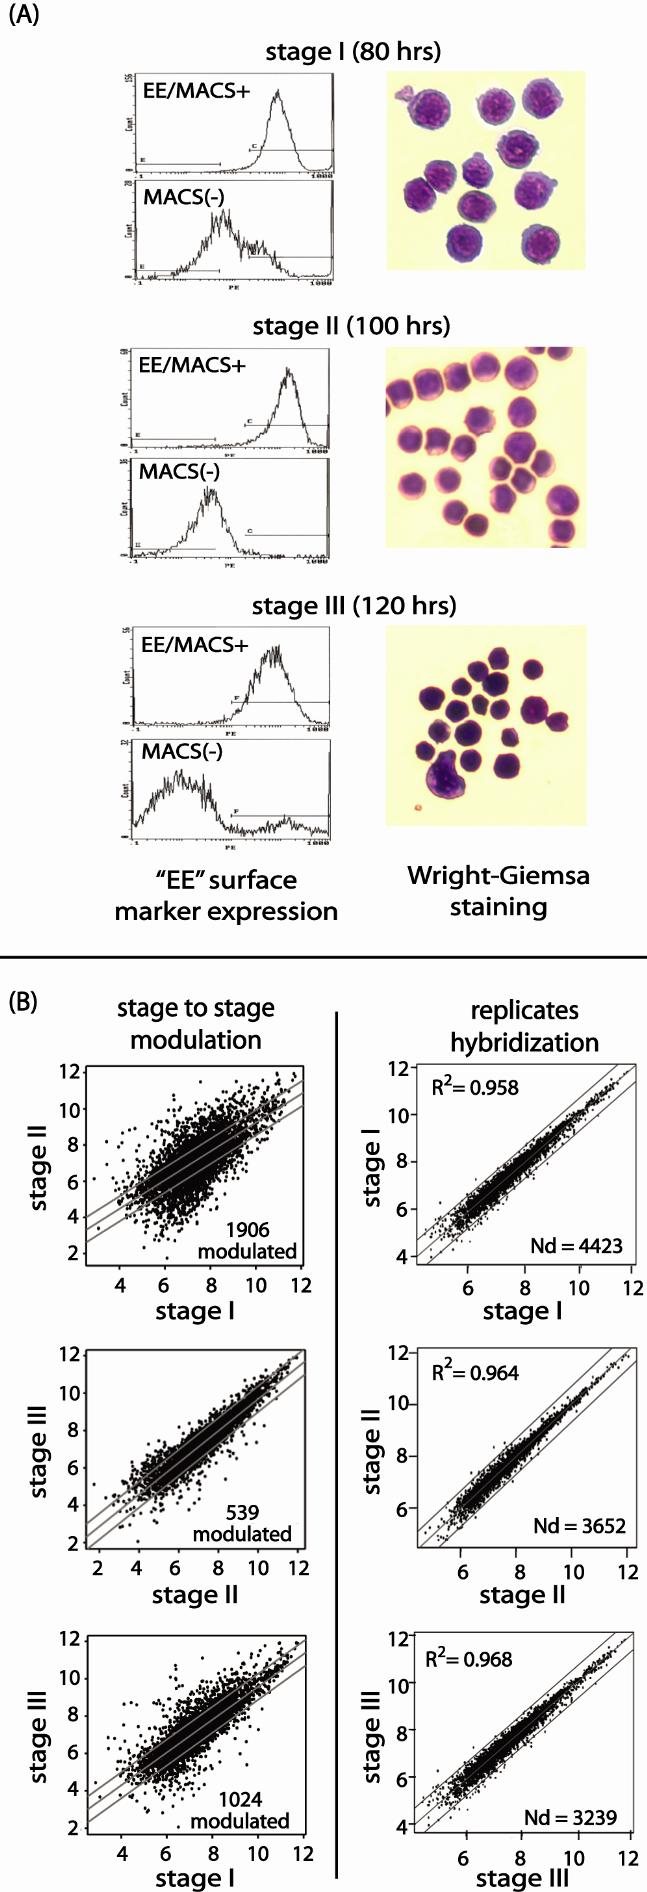
- Figure S2. Modulation of transcription and chromatin factors during splenic erythroblast development (JPG, 112 KB) -
(A) Summary expression profiles for major (erythroid) transcription factors — Graphed are mean expression values for NFe2 & Maf-g; Tal1, Lmo2, Gata1, Fog1 and Eklf during stage I-III development. Values are grouped as High (9 to 10.5), Medium (7.5 to 9) or Low (5 to 7.5) expression intensities. Note the relatively sharp modulation profiles for NFe2 & Maf-g, and Lmo2 & Gata1 (and natural log scale). (B) Stage-specific modulation of transcription and chromatin factors — Upper panels graph transcripts increased at stages I-to-II, while lower subpanels graph transcripts with decreased stage I-to-II expression.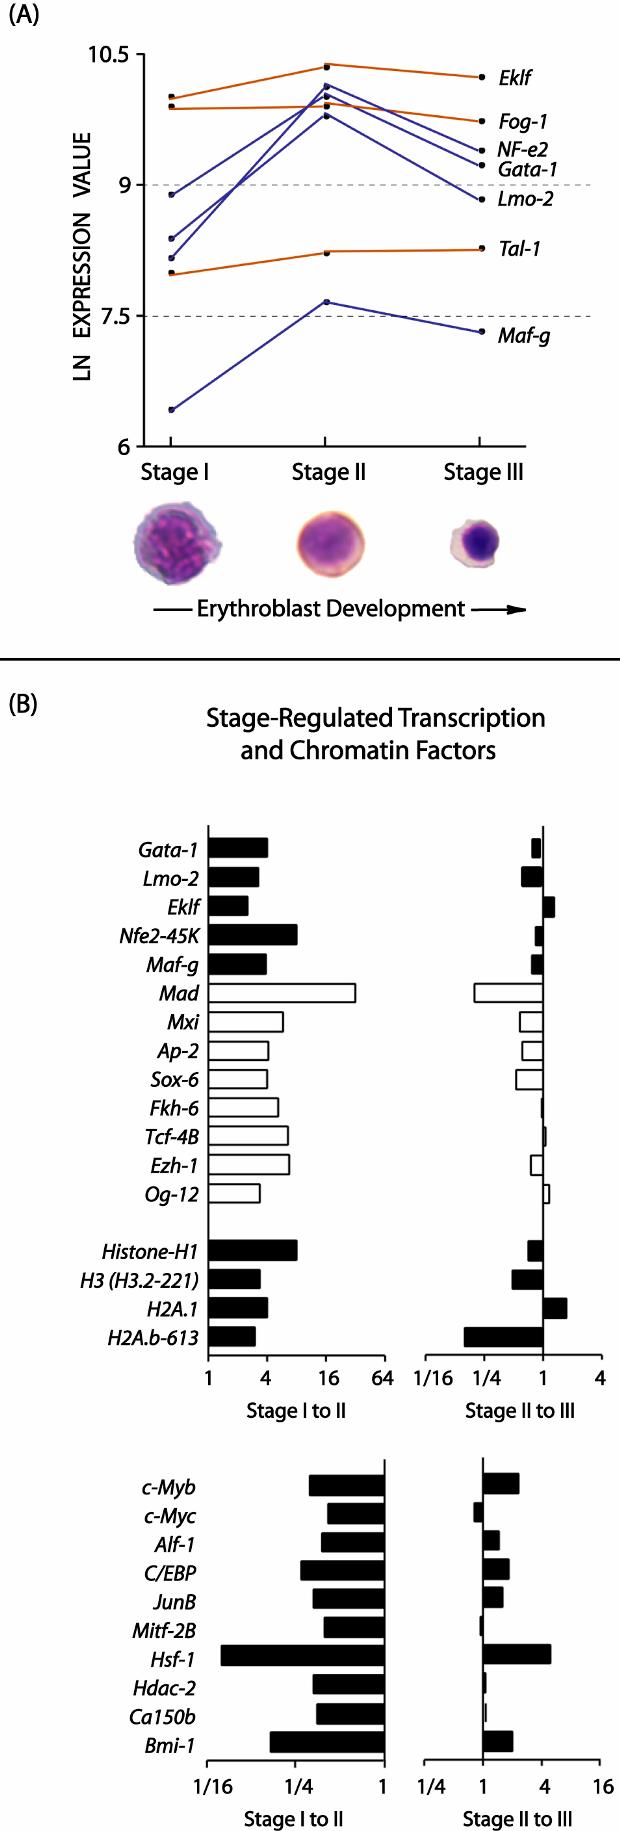
- Figure S3. Modulation of erythroblast cell cycle and signal transduction factors during splenic erythroblast development (JPG, 128 KB) -
(A) Profiling outcomes are shown for cell cycle associated factors that were modulated during stage I-III development. Plotted are fold-changes in expression intensities in stage I-to-II, and stage II-to-III transitions. (B) Genes up-regulated, or down-regulated at stage I-II are graphed in upper and lower subpanels, respectively. For signal transduction factors, expression profiles are shown for factors modulated at stage I-to-II and II-to-III transitions.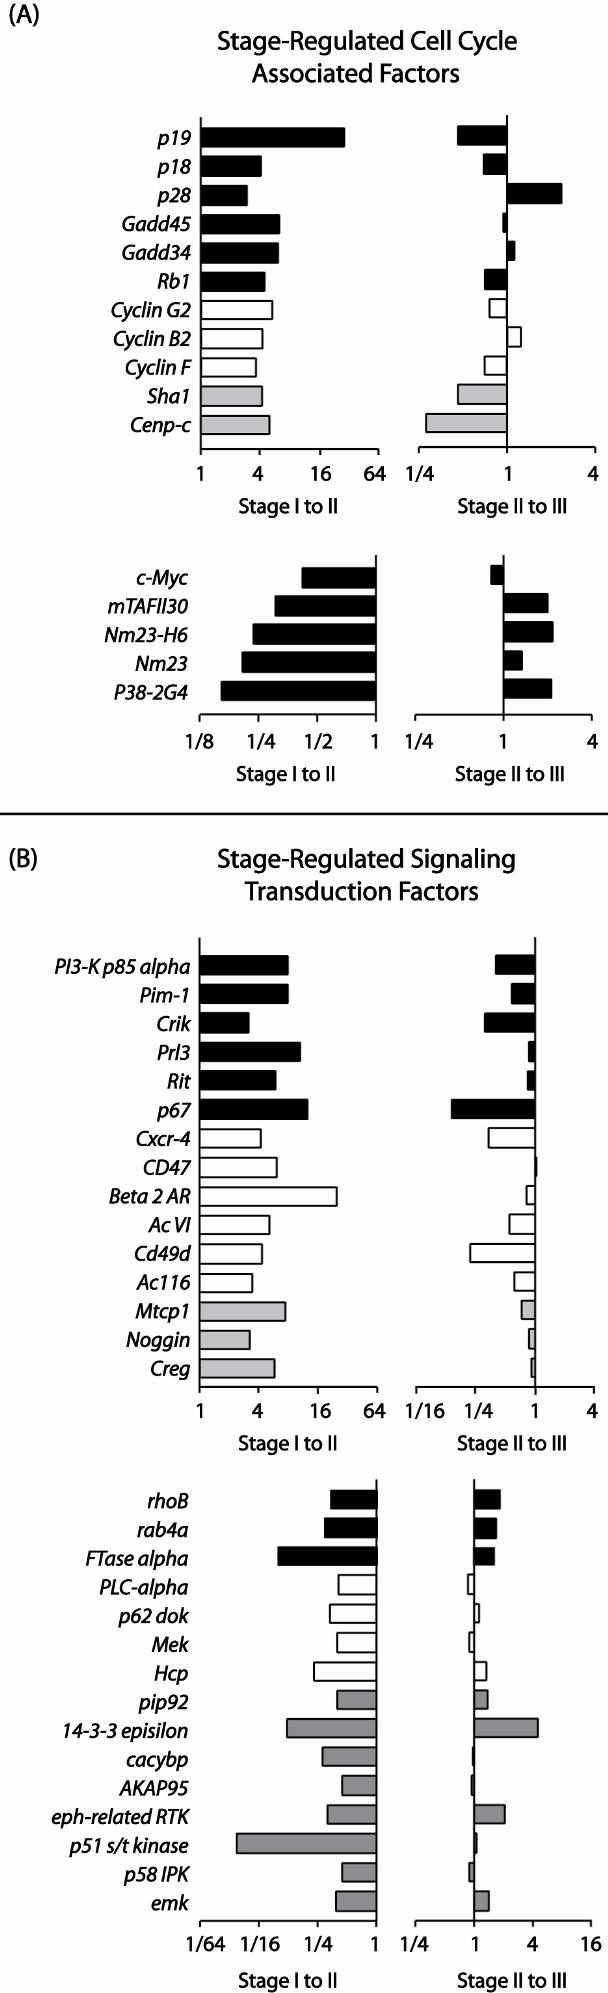
- Figure S4. DAPK2 expression among hematopoietic cell lines, lineages, and select tissues (JPG, 61.9 KB) -
Upper panel: DAPK2 levels in select mouse (NIH-3T3, OP9, JC4 and EML) and human cell lines (HL60, K562, Daudi, Jurkat and U937) were analyzed by western blotting. Note the elevated DAPK2 expression in erythroid JC4 and K562 cells. NIH-3T3 cells were maintained in Dulbecco’s Modified Eagle’s medium (DMEM) (Sigma #D5796), 10% bovine serum (Gibco #26170-035, Langley, OK); OP9 cells in Iscove-modified Dulbecco’s medium (IMDM) (Gibco #12440), 20% fetal bovine serum (FBS) (Hyclone #SH30070.03, Logan, UT); JC4 cells in IMDM, 15% FBS, 2 U/mL EPO and 100 ng/mL mSCF (Peprotech #250-03, Rocky Hill, NJ), 10−7 MTG (Sigma); EML cells in IMDM, 20% horse serum (Gibco #26050-070), 100 ng/mL mSCF; and UT7epo cells in IMDM, 10% FBS, 1 U/mL EPO. Center panel: DAPK2 expression in hematopoietic cells. Hematopoietic lineages were expanded as pre/pro-B cells in BIT-9500 medium (StemCell Technologies Inc # 09500), 5% FBS, mIL-7 (Peprotech #217-17) and mSCF on stromal feeder cells; as granulocyte/monocytes in mIL-6 (Peprotech #216-16), mIL-3 (Peprotech #213-13) and mSCF; as mast cells in mIL-3 plus mSCF; and as erythroid progenitor cells as detailed below. Cultures received fresh medium (and cytokines) at 2 day intervals. Lower panel: DAPK2 expression was also analyzed in lysates of kidney, liver, brain, heart, and the spleen of phenylhydrazine-treated mice.
- Figure S5. Gata1-IE3.9int transgenic expression of DAPK2 modestly affects steady-state erythropoiesis, but leads to fatality during hemolytic anemia (JPG, 85.1 KB) -
(A) Gata1-IE3.9int-DAPK2 transgenic lines exhibit modestly increased reticulocyte levels, and decreased hematocrits — In F4 and F5 transgenic lines (and in control wild-type littermates) (wt, wild-type), reticulocyte levels and hematocrits at steady-state were determined. Mean levels among 10 to 15 mice per line are graphed. (B) Modestly elevated splenic erythroblast levels in Gata1-IE3.9int-DAPK2 mice — This is illustrated in representative flow cytometry analyses of spleens from Gata1-IE3.9int-DAPK2 vs. wild-type control mice at steady-state. (C) For a significant portion of Gata1-IE3.9int-DAPK2 mice, anemia induced by phenylhydrazine was irreversible, and fatal. (D) Gata1-IE3.9int-DAPK2 mice also exhibit attenuated erythropoiesis during 5-fluorouracil (5FU) induced anemia — Gata1-IE3.9int-DAPK2 mice (n=4) and wild-type littermates were treated with 5FU (150mg/kg IP). Hematocrits then were determined over a 20-day time course, and are graphed as means +/− SD.
- Figure S6. In primary bone marrow erythroblasts, Gata1-IE3.9int-DAPK2 potentiates apoptosis and limits erythroblast formation in a stage-specific fashion (JPG, 111 KB) -
(A) For SP34-EX expansion cultures from wt-EPOR and EPOR-HM allele marrow preparations, frequencies of apoptotic cells were assayed among developmentally staged erythroblasts (based on stage-specific cell surface markers and annexin-V staining). (B) Lineage-depleted erythroblast populations also were prepared, and replated in SP34-EX medium in the presence of EPO at 0.0, 0.06 and 0.12 U/mL. At 16 hours, frequencies of apoptotic cells were determined. (C) To confirm profiles of EPO-dependent (pro)erythroblast survival, cell death as assayed using FITC-Annexin V was analyzed in parallel with YoPro1. Here, splenocytes from phenylhydrazine-treated mice (75mg/kg SC) were isolated at day 3.5. Linpos cells then were depleted and erythroid progenitors were then cultured for 24 hours in SP34-EX medium containing EPO at 0, 0.0625, 0.125 or 0.25U/mL. Cell death profiles then were analyzed by flow cytometry. Note the parallel profiles for total progenitors, late Ter119pos progenitors, and earlier Ter119neg progenitors. (D) Formation of bone marrow erythroblasts within KitposCD71highTer119neg, KitnegCD71highTer119neg, and KitnegCD71highTer119pos compartments was analyzed over a 4-day course of development. Data shown are for two independent (and representative) experiments.