[View Larger Version of this Image]
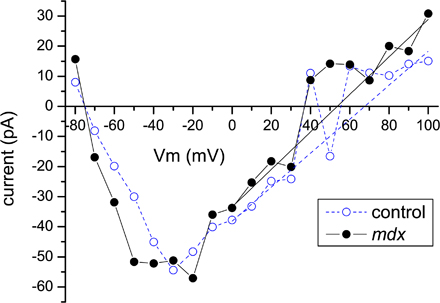
Figure S1. To measure Na reversal potential (VNa) in the control and mdx fibres, we collected peak currents and performed linear fits of the tail regions of attained IV curves, determining their intersections with I = 0 line. Stimulation protocols used to evoke Na+ currents are described in Materials and methods. In short, cell-attached patches, held at −100 mV between stimulation applications, were hyperpolarized to −120 mV for 30 ms in order to ensure recovery of VGSCs from inactivation. Then sampling depolarizing pulses were applied to the potentials ranging from −70 to +40 (compact protocol) or +100 mV (extended protocol). The stimulation protocol with sampling potentials reaching +100 mV allowed direct observation of current inversion and served as independent measure verifying validity of determined reversal potentials. Unfortunately, application of such voltages caused common patch instability. Moreover, small amplitude of peak currents evoked by sample voltages near VNa introduced a significant divergence of apparent peak currents as well as prohibited performing meaningful fits with Hodgkin-Huxley model, as was described for the bulk of measurements. Instead, peak currents were determined as apparent peaks of the current traces smoothed by the three-point running average, using clampfit program (pClamp-9 suite). Fig. S1 shows sample IV relationships collected in such way for control (blue open circles) and mdx (black filled circles). Of note are clearly divergent peak current amplitudes at voltages near VNa (40–80 mV). In order to determine the I = 0 crossings, the tails of these IV curves were fit with linear dependence in the region of 0–100 mV, skipping the apparently diverging peaks in the 40–80-mV range. These crossings were collected and averaged first over traces corresponding to the same patches and then for all patches, yielding 67.8 ± 6 mV for control and 52.7 ± 5 mV for mdx cells.
While peak currents evoked by sample voltages of 40 mV and higher showed a significant instability, peak currents evoked by sampling voltages of 30 mV and less were significantly more stable. Moreover, these traces could be reliably fit with Hodgkin-Huxley dependence as described, further enhancing reliability of IV curves, prompting us to use the more compact protocol for performing bulk measurements of stimulated Na+ currents. Determination of I = 0 crossings for such traces was done by performing linear fits to the tails of IV curves in the 10–30-mV range in a manner similar to described above. While such determination involved extrapolation of IV dependence out of the range of applied voltages, it yielded results in a good agreement with the ones determined from the traces stimulated with the extended protocol (69.9 ± 5 mV for control and 51.7 ± 5 mV for mdx fibres). Combining these independent measurements we obtain the overall VNa of 69.6 ± 5 mV for control and 52.5 ± 5 mV (mean ± SEM, P = 0.02) that were used to determine under-sarcolemma [Na+] as described.