[View Larger Version of this Image]
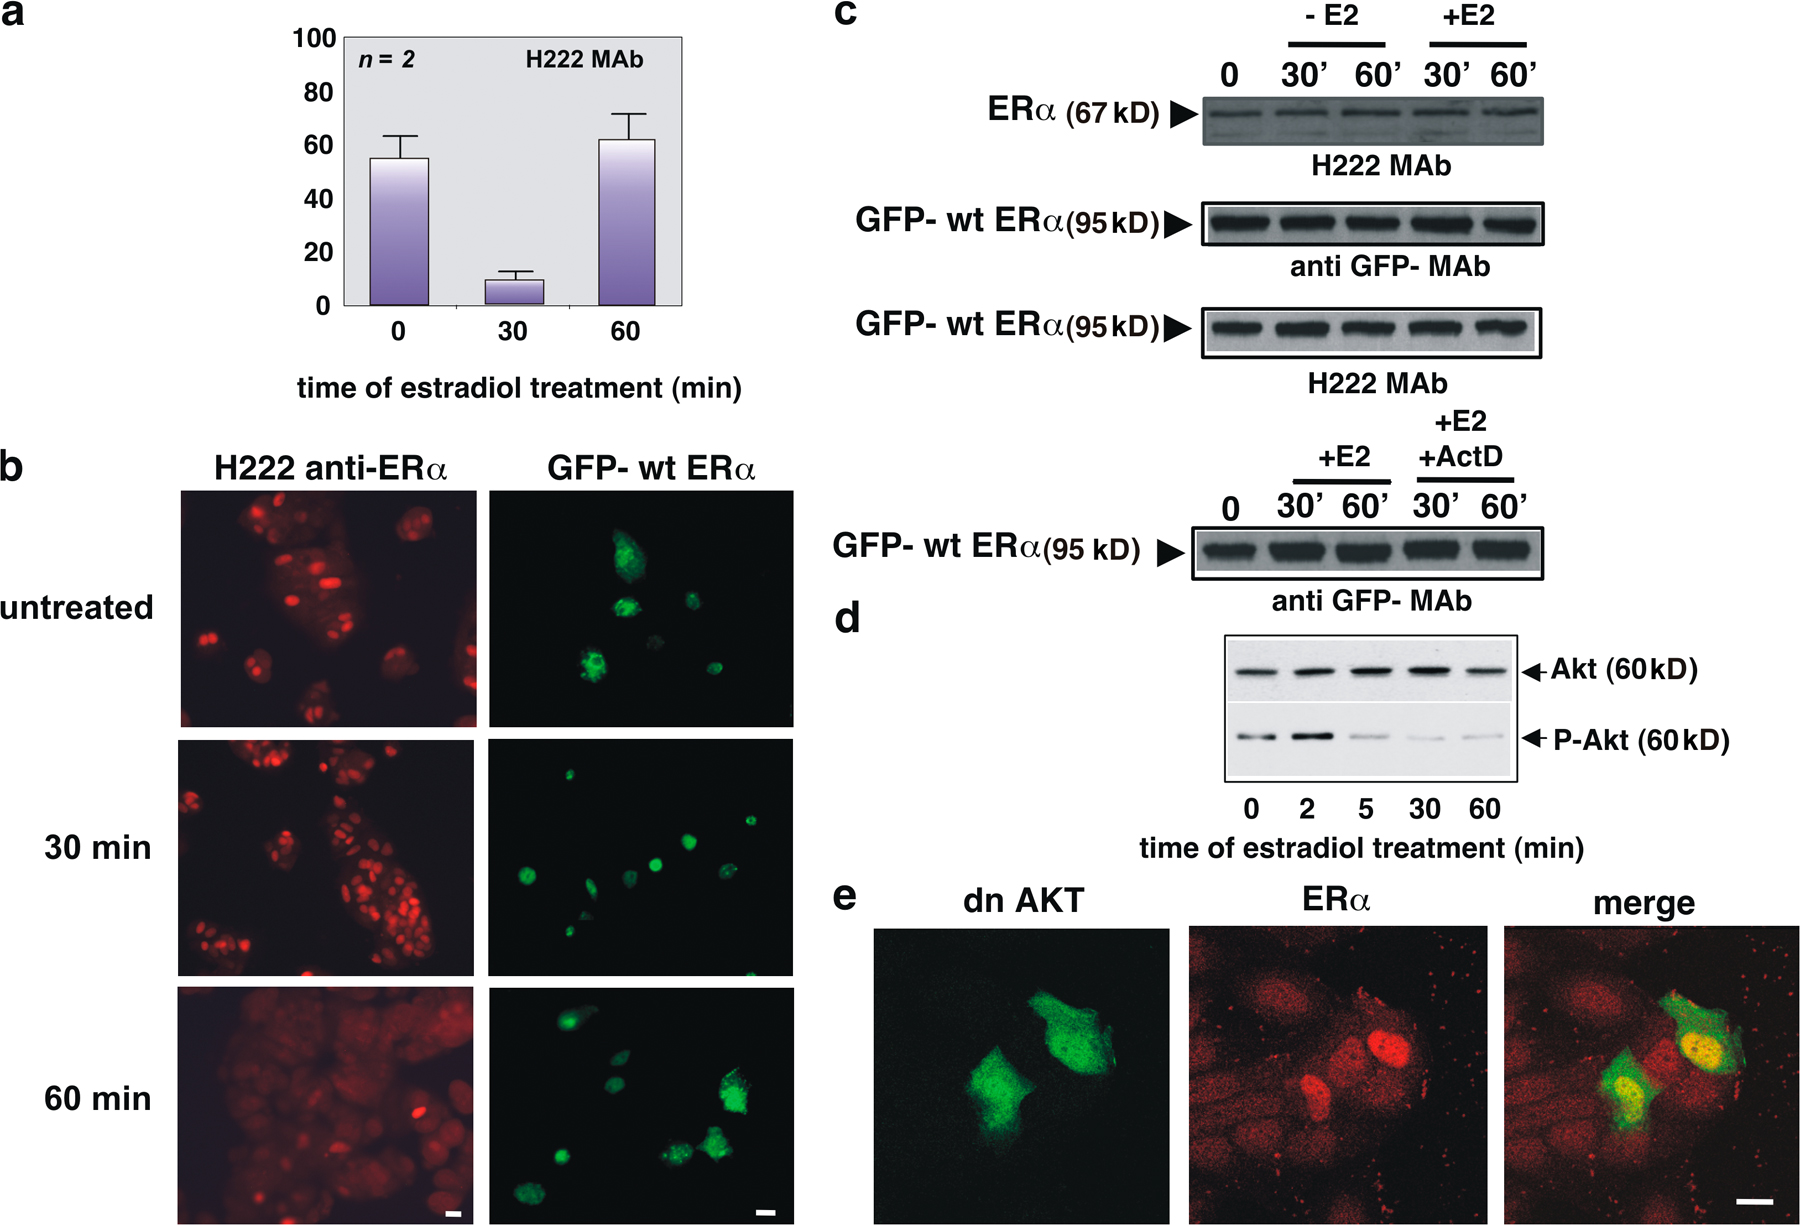
Figure S1. The cytoplasmic localization of endogenous ER in indirect IF staining of untreated or estradiol-treated MCF-7 cells. Quiescent MCF-7 cells were used. (a) Cells were untreated or treated with 10 nM estradiol (E2) for the indicated times. ERα localization was analyzed by immunofluorescence using the rat anti-ERα mAb (H222 mAb). Cells that fell into the category of cytoplasmic fluorescence were scored, and data were expressed as a percentage of total cells. Data were derived from at least 500 scored cells. The results of several independent experiments were averaged; means and SEM are shown. (b, left) Microphotographs represent images from one experiment in Fig. 1 a. They show the localization of ERα in MCF-7 cells untreated or treated for with 10 nM estradiol for the indicated times. (right) Microphotographs represent images from one experiment in Fig. 1 b. They show the localization of GFP-wtERα in MCF-7 cells untreated or treated with 10 nM estradiol for the indicated times. (c) Untransfected cells were untreated or treated with 10 nM estradiol for the indicated times. Lysates were prepared and analyzed by Western blotting using the rat monoclonal H222 anti-ER antibody. (b and c) Cells were transfected with GFP-wtERα and untreated or treated with 10 nM estradiol for the indicated times. Lysates were analyzed by Western blot using the antibodies against the indicated proteins. (d) Cells were untreated or treated with 10 nM estradiol for the indicated times. Lysates were prepared and immunoblotted with appropriate antibodies for detection of P-Ser473-Akt (P-Akt; bottom). The filter was reprobed with the anti-Akt antibody (Akt; top). (e) Microphotographs represent confocal images from one experiment in Fig. 1 d showing that overexpression of the dominant-negative Akt (dn Akt; green) retains ERα (red) in nuclear compartment of 60-min estradiol-treated MCF-7 cells. A merged image is also shown. Bars, 5 µm.